SATELLITE BREAKUP ANALYSIS
HYPERVELOCITY COLLISIONS
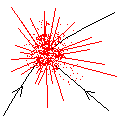 Collisions between objects in space are invariably hypervelocity
collisions. Such a collision is defined as one where
the velocity (v) of the impactor (relative to the target) is so great
that its kinetic energy ( K = ½ m v2) is greater
than the energy released in the detonation of the same mass (m) of
high explosive.
Collisions between objects in space are invariably hypervelocity
collisions. Such a collision is defined as one where
the velocity (v) of the impactor (relative to the target) is so great
that its kinetic energy ( K = ½ m v2) is greater
than the energy released in the detonation of the same mass (m) of
high explosive.
Given that the energy density of a typical high explosive (TNT) is
4.2 x 10⁶ Joule/kg, we can compute the transition to hypervelocity
from:
which gives us v ~ 3 km/sec. It is thus usual to regard a hypervelocity
collision as one in which the relative velocity between target and
impactor is 4 km/sec or greater.
In low Earth orbit, the velocity of a satellite is between
7 and 8 km/sec, and the typical collision velocity between two space
objects in LEO is around 10 km/sec. Thus most accidental LEO
collisions are hypervelocity collisions. The deliberate destruction
of a satellite with a terrestrially launched missile will also be
a hypervelocity collision. The missile does not need to carry an
explosive warhead, as the destruction from the kinetic impact is
greater than what could be achieved by high explosive.
A hypervelocity collision may be categorised as catastrophic or
non-catastrophic. A catastrophic impact is one in which both the
target and the impactor are totally destroyed, producing a range
of fragments. In a non-catastrophic impact the impactor is
detroyed and the target is damaged (or cratered), but not totally
destroyed. Hypervelocity experiments have shown that target
destruction usually results when the impactor kinetic energy is
greater than 40,000 Mt Joule, where Mt is the mass
of the target. If we
designate the mass and relative velocity of the impactor as
Mi and v respectively, we can calculate the
ratio of target to impactor mass (the factor Γ = Mt / Mi)
which divides the two classes of collision behavior:
For a relative collision velocity of 10 km/sec, Γ ~ 1250. Other
data indicate that Γ may be as high as 2500 for
a catastrophic collision.
Non-Catastrophic Collision
For this case:
In this case the impactor is totally destroyed and the ejected mass
Me is given by:
where experiment has shown that γ ~ 120 for collision velocities
around 10 km/sec.
Catastrophic Collision
For a catastrophic collision:
Both the impactor and the target are totally destroyed and the
ejected mass is the sum of the two masses:
In many cases the impactor mass is such a small fraction of the
target mass that the ejected mass is essentially the target mass.
Fragment Mass Distribution
A simplified model developed at the NASA Orbital Debris Program
Office allows the approximate calculation of the mass distribution
of the fragments ejected in a hypervelocity collision:
N(>m) = 0.8 ( m / Me )-0.8
where
N(>m) is the number of fragments ejected with mass m or greater
Thus a lot more small fragments are produced than are large fragments.
This expression produces an infinite number of very small fragments
which is physically unrealistic. There is a limit at which the
production of small fragments drops off. A modified form of the above
expression which takes this into account could be written as:
N(>m) = 0.8 ( ( m + δm ) / Me )-0.8
where δm is related to the smallest sized particles produced.
There is not much data on this size, but we have used δm =
5 x 10⁻⁶ in simulations below. This is below the
size of particles that can be detected individually by current surveillance
sensors.
The size (s) of a fragment of mass (m) depends of course on the fragment
shape and the density (ρ) of the material of which it is made.
As a very simple approximation, fragments are taken to be spherical
particles. While this may be close to reality for the small particles,
it is not true for the larger mass fragments. It does however, make
analytical calculations possible which would other not be possible,
and which would required a detailed knowledge of fragment shapes.
For spherical particles, where s is taken to be the diameter of the
particle:
In a further simplification, we take ρ~2000 kg/m3
(the density of aluminium, the most common material used in spacecraft
construction is 2700 kg/m3), giving:
A fragment of mass 1 kg thus has a rough size of 0.1 m or 100 mm,
whereas a 10 mm fragment will have a mass of 0.001 kg or 1 gram.
Because of the cube law dependence of mass on size, an order of
magnitude change (ie a power of ten) in size results in a three
order magnitude change in mass.
Fragment Velocity Distribution
Small mass fragments will on average be ejected at greater velocities
than large fragments. For sizes greater than 100mm (ie masses
greater than 1kg), 80% of the fragments will be ejected with velocities
under 250 metres/sec. Reynolds has developed an empirical formula
relating modal ejection velocity (ΔV) to fragment size:
log( ΔV ) = 1.486 - 0.804 log( s ) - 0.0676 log2( s )
where ΔV is in metres/sec and s is in metres (ie strict SI units).
Note that ΔV is the most probable velocity in a distribution that
extends sensibly from about 0.1 ΔV to about 1.3 ΔV.
The table below presents results computed using the previous formulae
for a catastrophic satellite collision of a hypothetical target of mass
one ton.
	SATELLITE BREAKUP MODEL (CATASTROPHIC)

	Target Mass =  1000 kg

	Size(mm)  Mass(kg)    N(>m)   dVel(m/s)  N(unbounded)
	    1     0.000001   3023912   1947.1      12679149
	    2     0.000010   1452838   1409.5       2009510
	    5     0.000100    306294    985.7        318486
	   10     0.001000     50276    665.9         50477
	   22     0.010000      7997    434.6          8000
	   46     0.100000      1268    274.0          1268
	  100     1.000000       201    166.8           201
	  215    10.000000        32     98.1            32
	  464   100.000000         5     55.8             5
The column of fragment numbers N(>m) is computed using the modified
mass fragment formula which limits the production of very small
particles. The column marked N(unbounded) lists the results of the
unmodified formula for comparison. The size is computed on the
spherical particle approximation with a density of 2000 kg/m3
and dVel is the modal ejection velocity.
It is interesting to compare these results with the fragments observed
and estimated from the Chinese ASAT (anti-satellite) test of 12 Jan 2007
where the target (an old weather satellite FY-1) had a mass close to
the above model mass (ie 1000 kg):
	Size s (mm)      N(>s)

 	   10             2,600
            1           150,000
	    0.1       3,000,000
Note that only the >10mm are regularly trackable by the US Space
Surveillance Network. Other sensors employed at irregular times
can provide information down toward the 1mm size, and the last
row is a best estimate.
While the N(>0.1mm) value agrees well with model, the >10mm numbers
are an order of magnitude higher than the model, and the >1mm numbers
are three times the model prediction. One possible explanation is that
the model is based on fragment mass. The fragment size is derived
from the mass on the basis of a relatively compact spherical particle.
If the Chinese test produced relatively planar fragments (or bent plates),
the mass of such fragments will be a lot less than the mass of a
compact sphere of the same size (the size of the plates being measured
in the plane of the plate - not its thickness). In this case a given
real fragment size refers to a smaller mass than in the model, and the
smaller mass will be present in larger numbers. The discrepancy
becomes less as the size of the plate approaches its thickness, and
the fragment becomes a better approximation to a compact object.
Various formula have been used to relate the size and mass of a debris
fragment. The above table used a spherical particle model with a
diameter s and a density ρ = 2000 kg/m3. In this
model the size and mass are related by the previously quoted formula:
s = ( 6 m / ( π ρ ) )0.333 [s1]
Another approach is to note that the average space object has a mass to
cross-sectional area ratio of m/A = 100. This produces a mass-size
relationship of:
or alternatively a slightly more accurate relation m = 62 A1.13,
which gives:
The following table lists size values for s1 using densities of 2000
and 1000 kg/m3 (the latter is the density of water) plus
the two size values computed using s2 and s3:
	SPACE DEBRIS FRAGMENT SIZE

	   Mass    Size(mm)  Size(mm)  Size(mm)  Size(mm)
	   (kg)    rho=2000  rho=1000  m/A=100   m=62A^1.13

	  0.000001     1.0       1.3       0.1       0.4
	  0.000010     2.2       2.7       0.2       1.1
	  0.000100     4.6       5.8       0.8       3.1
	  0.001000    10.0      12.6       2.6       8.6
	  0.010000    21.5      27.1       9.1      23.7
	  0.100000    46.4      58.5      31.7      65.4
	  1.000000   100.0     126.0     110.0     180.0
	 10.000000   215.4     271.5     381.4     495.8
	100.000000   464.2     584.8    1322.5    1365.4
The use of the lower density relationship ( s1 with ρ=1000 ) is the
only one that helps reduce the discrepancy between the model and the
Chinese ASAT data, but not sufficiently to warrant its use. Even
lower densities help bring the >10mm results into line, but not
the >100mm values. Only a variable density with size (as suggested)
appears adequate, with very low apparent densities for large fragments
increasing to more typical values for the small sizes.
Orbital Parameter Changes
As each fragment is ejected from the collision it assumes a new orbit
dependent upon the magnitude of the ejection velocity, and the direction
of this velocity vector with respect to the velocity vector of the
satellite at the time of collision. The momentum of the impactor is
generally so much smaller than the momentum of the target that it can
be ignored.
The component of the velocity in the direction of the original target
orbit will affect the shape and size of the orbit. An initially
circular orbit will be turned into an elliptical orbit with a different
period than the circular orbit. Whether the ellipse if larger or
smaller than the original circle is determined by whether the velocity
component is in the same or opposite direction as the original target
motion. This is illustrated in the figure below.
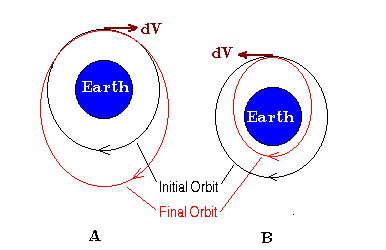
The left side of the figure (A) shows the orbital change
that results from a velocity increment component along the
direction of the satellite track. The originally circular
orbit becomes an ellipse with a perigee equal to the circular
radius, and a larger apogee. In (B) the velocity component
is in the direction opposite to the satellite motion. The
orbit becomes elliptical, with the apogee now equal to the
circular radius, and a smaller perigee.
The perigee (q) is the closest distance of the orbit to the Earth and
the apogee (p) is the furthest distance of the orbit from the Earth.
The sum of the two is twice the semi-major axis (a) of the ellipse.
The perigee and apogee are also related to the semi-major axis by
the eccentricity (e) of the ellipse:
p = a ( 1 + e )
q = a ( 1 - e)
p + q = 2 a
Given the velocity (vc) and radius (rc) of an
initial assumed circular orbit, as well as a tangential velocity
component δv, we can compute the size parameters and the period
of the new orbit. We need to consider the positive (along track) and
negative (opposing track) velocity increments separately.
POSITIVE VELOCITY INCREMENT
a = GM / ( vc2 - 2 vc δv )
q = rc
e = 1 - rc / a
p = a ( 1 + e )
T = 2 π √( a3 / GM )
NEGATIVE VELOCITY INCREMENT
a = GM / ( vc2 + 2 vc δv )
(Note that δv is the magnitude of the velocity increment)
p = rc
e = ( rc / a ) -1
q = a ( 1 - e )
T = 2 π √( a3 / GM )
The period of the original circular orbit is:
The following tables give an idea of the magnitude of orbital
changes that may occur as a function of increments velocity.
ORBIT CHANGE - delta V along track positive

 Initial      V=50m/s    V=100m/s    V=150m/s    V=200m/s    V=250m/s
 Ht   Per    Ht   Per    Ht   Per    Ht   Per    Ht   Per    Ht   Per
 200  88.4   371  90.1   546  91.9   726  93.7   911  95.6  1102  97.6
 300  90.4   475  92.2   654  94.0   839  95.9  1028  97.9  1223  99.9
 400  92.4   579  94.3   762  96.1   951  98.1  1145 100.1  1344 102.2
 500  94.5   683  96.4   871  98.3  1063 100.3  1262 102.4  1465 104.6
 600  96.5   787  98.5   979 100.5  1176 102.6  1379 104.7  1587 107.0
 700  98.6   891 100.6  1087 102.7  1289 104.8  1496 107.1  1709 109.4
 800 100.7   995 102.8  1195 104.9  1401 107.1  1613 109.4  1831 111.8
 900 102.8  1099 105.0  1304 107.1  1514 109.4  1730 111.8  1953 114.2
1000 105.0  1203 107.1  1412 109.4  1627 111.7  1848 114.2  2075 116.7
1100 107.1  1307 109.3  1521 111.7  1740 114.1  1966 116.6  2198 119.1
1200 109.3  1412 111.6  1629 113.9  1853 116.4  2083 119.0  2321 121.6


ORBIT CHANGE - delta V along track negative

 Initial      V=50m/s    V=100m/s    V=150m/s    V=200m/s    V=250m/s
 Ht   Per    Ht   Per    Ht   Per    Ht   Per    Ht   Per    Ht   Per
 200  88.4    33  86.7  -129  85.1  -287  83.5  -442  82.0  -593  80.5
 300  90.4   130  88.6   -36  87.0  -198  85.4  -356  83.8  -511  82.3
 400  92.4   226  90.6    56  88.9  -110  87.2  -271  85.6  -429  84.1
 500  94.5   322  92.6   148  90.9   -21  89.2  -186  87.5  -347  85.9
 600  96.5   418  94.7   241  92.8    68  91.1  -100  89.4  -265  87.7
 700  98.6   514  96.7   333  94.8   157  93.0   -15  91.2  -183  89.5
 800 100.7   610  98.7   425  96.8   245  94.9    70  93.1  -101  91.4
 900 102.8   706 100.8   518  98.8   334  96.9   155  95.0   -20  93.2
1000 105.0   802 102.9   610 100.8   422  98.9   239  96.9    61  95.1
1100 107.1   898 104.9   702 102.9   511 100.8   324  98.9   143  97.0
1200 109.3   994 107.0   794 104.9   599 102.8   409 100.8   224  98.9
The first table is for positive velocity increments, and the second
is for negative velocity increments, both along the original orbital
path. The first two columns give the height(km) and period(minutes)
of an initial circular orbit. The next five sets of two columns
give the same quantities (height and period) for different incremental
velocity changes. In the positive increment case, the height is the
apogee of the ellipse, the perigee being equal to the circular height.
In the the negative case, the height is the perigee of the ellipse,
the apogee being equal to the circular height.
A negative value for the perigee means that it is
below the surface of the Earth. A fragment
traversing such an ellipse will obviously not complete one orbit, but
will either burn up on re-entry or hit the Earth within less than
one-half of the orbital period. (Even were the fragment to hit the
Earth, only a fraction of its initial mass would survive ablation
travelling through the atmosphere).
Velocity increments out of the original orbital plane tend not to
change the shape of the orbit significantly but do change its
orientation in space. In particular, the inclination of the orbit
may be changed. The change depends on where the velocity increment
occurs. The greatest change to inclination occurs when the velocity
increment occurs around the equator, and is least when the sub-latitude
of the target is near its inclination value (positive or negative).
Gabbard Diagrams
John Gabbard developed a diagram, named after him, that is very useful
for illustrating the orbital changes we have just been discussing.
A Gabbard diagram is a scatter plot of height versus period. The
apogee and perigee of each ejected fragment is shown as a point on
the diagram. The resultant plot looks like two asymmetrical boomerangs
joined at their apices. An example is shown below:
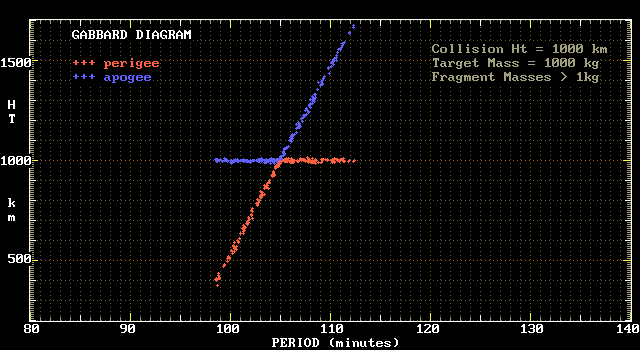
The data used to make this plot is the data in the aforementioned
example of a 1000 kg target. Only mass fragments 1 kilogram and
larger have been used to compile the diagram. The catastrophic
collision is assumed to have taken place at an altitude of 1000 km.
The point where the two lines intersect is the original circular
orbit at an altitude of 1000 km and with a period of 105 minutes.
Points to the right of this location represent fragments that have
been scattered in the forward direction of motion, while points to
the left represent fragments scattered opposite the initial target
motion. Note how the perigee heights (red points) in the first
case become the apogee heights (blue points) in the second.
The next diagram illustrates how the smaller fragments are scattered
into larger and smaller orbits than are their more massive counterparts.
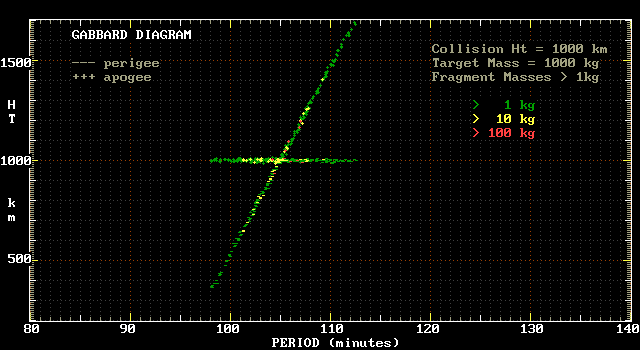
In this case apogee (+) and perigee (-) points are distinguished by different
symbols, and the different colours are used to indicate different
masses. It can be seen that the largest masses (≥100 kg) are
relatively close to the original orbit, whereas the smallest masses
(≥1kg) are the most dispersed.
Debris Orbital Decay
Gabbard diagrams are also useful for indicating the orbital decay of debris
fragments. We have already seen in one of the tables above that
when a collision occurs at a sufficiently low altitude some of the
fragments that are ejected in the opposite direction to the original
motion will be forced into orbits with a perigee below the Earth's
surface. These will undergo atmospheric entry in less than half
the period of their orbit. Because most of these particles will be
those of smaller mass, they will in general burn up during reentry.
Heavier fragments that may have a chance of depositing at least some
of their mass on the Earth's surface will generally be the last
fragments to decay due to atmospheric drag.
It is not necessary for a fragment to have a negative perigee to
survive less than one orbit. Any fragment with a perigee of less
than about 100 km will encounter so much air resistance (drag) that
it will never make it back to apogee, and will deorbit in less than
one period.
Fragments above this height will lose energy, mostly at perigee,
and this will reduce their apogee height. Interestingly enough,
their perigee height changes a lot less, until the apogee is
brought down close to the perigee. The lower the perigee height
of a fragment the larger the reduction in apogee height. This
is seen on a Gabbard diagram as a drooping of the apogee plot at
the left of the diagram.
The following two diagrams illustrate this decay. The first diagram
is a plot within one orbit of the collision, which this time has
taken place at a height of 300 km.
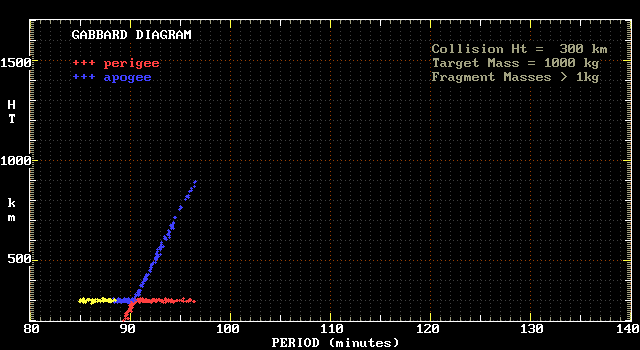
The yellow points represent those fragments with perigees below
100 km, and which are thus not present after one orbit.
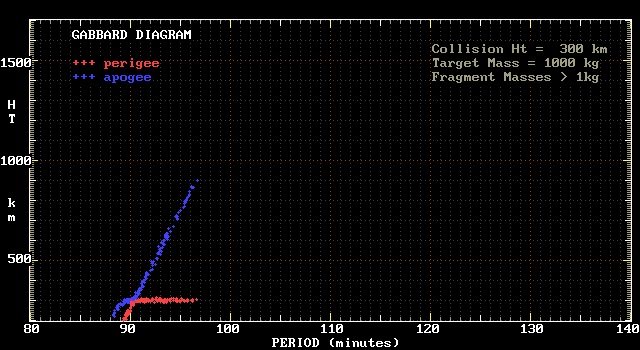
Note the progressive droop in apogee as the period gets smaller.
This plot simulates the fragment population some days after the
collision, in conditions of sunspot minimum (ie
minimal solar X-ray and shortwave UV output, which implies low
atmospheric densities in the upper atmosphere).
Australian Space Academy