INTRODUCTION
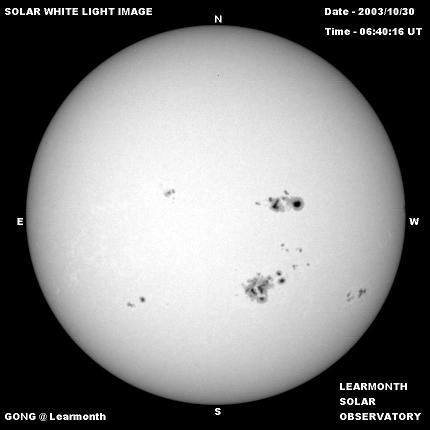
Sunspots are dark features that are visible on the solar disc in unfiltered light. They are associated with and in fact created by strong magnetic fields that grow and decay in time frames from hours to months.
Sunspots occur in groups, with the spots in each group being linked together by the magnetic fields that surround them. The group shows a growth and decay with a lifetime dependent upon the maximum size (area) attained by the group. Sunspots groups can be categorised in a number of ways - the two most often used are the total area of the group, the number of individual spots in the group. Sunspots have many interesting properties and these are discussed later.
SUNSPOT DETAIL
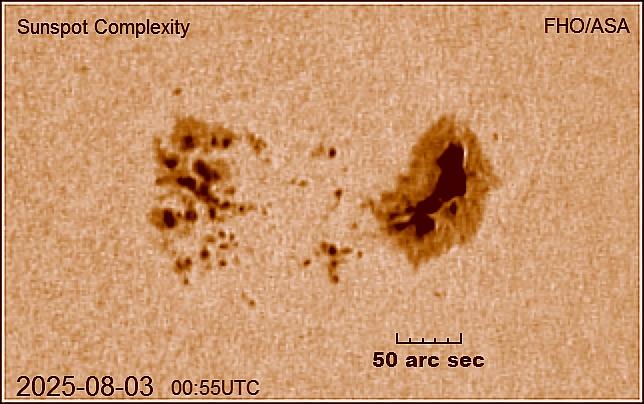
As we increase the resolution of our observations, we find continually more detail in the structure of sunspots. The image below represents what can be achieved in a big city at sea level using a small telescope and image processing (Courtesy Mal Wilkinson, Forest Hill Observatory).
The next image below illustrates the detail that can seen by a large dedicated solar telescope (the Swedish Solar Telescope) placed at a high altitude site (El Tiede on Tenerife in the Canary Islands - 7500m), above much of the atmospheric distortion. This image shows sub-arcsecond detail.
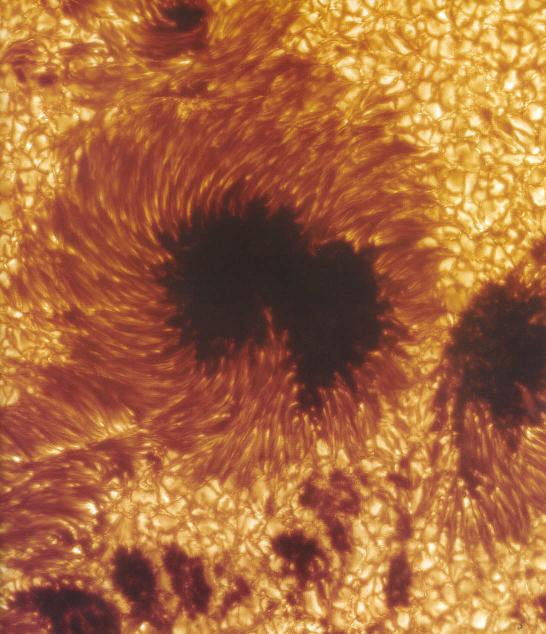
Note that the penumbra (the lighter of the two areas that comprise a large sunspot) is made up of fibrils which are aligned according to the prevailing magnetic field lines. Some detail can also be seen in the dark central umbra.
Some large sunspots have more than one umbra lying within a single penumbra. It is the number of umbra that are traditionally counted as individual spots when computing the sunspot number.
SUNSPOT CYCLES
One of the most interesting things about sunspots and sunspot groups is the periodicities that they display. These include a 27-28 day period (which is due to both solar rotation and the asymetric distribution of spot groups over the Sun) and the predominant cycle of round 11 years. From time to time there also appears other periodicities - one of 5 months recurs quite regularly. There are also claims for much longer periods of the order of decades and centuries. The truth about these latter claims however, is that we simply do not have data over a sufficiently lengthy period to make a definitive assertion.
The graph below clearly illustrates the major period (around 11 years) of the sunspot cycle.
What makes these periodicities of significance to us is the correlation with various behaviours of the terrestrial environment. It was in 1859 when a link between sunspots and the Earth's magnetic field was first suspected. An English solar astronomer by the name of Richard Carrington observed a sudden brightening (what we now call a flare) in and around a large sunspot group. Latter that night, a huge geomagnetic storm was detected by magnetometers in England (at Kew), and intense auroral displays were reported from many regions. Following this discovery many claims were made for the effect of sunspots on all sorts of processes. These are discussed more in the last section of the paper.
SUNSPOTS AND SUNSPOT GROUPS
Sunspots are dark areas that grow and decay on the lowest level of the sun that is visible from the Earth - the photosphere. We often refer to this level as the Sun's surface, even though the density there is only one-hundredth that of the Earth's atmosphere at sea-level. Sunspots are the most well-known and easily observed feature of the Sun which show its dynamic nature through their change in number and area.
Sunspots are darker than their surrounding area because they are cooler than the average temperature of the solar surface ( about 6000 Kelvin). The appearance and disappearance of sunspots is due to underlying changes in the magnetic fields that exist throughout the sun. Because the sun shows differential rotation (ie, the equator rotates faster than the poles), the magnetic flux lines become wound up inside. Instabilities in the process create some regions of intense magnetic field. These regions tend to exclude material from within them, become buoyant (because they are less dense) and rise to the surface. Thus is a sunspot region born.
A sunspot is first observed as a tiny dark spot called a pore. Not all pores develop into fully-fledged sunspot regions, but those that do undergo an interesting evolution over a period of hours to days. First of all the pore becomes darker and larger, but with no distinguishable internal features. Other spots may break out around the first one. Any significant size sunspot region can be observed to form as a double-ended group, and with an instrument known as a solar magnetograph it can be determined that spots at opposite ends of the group have opposite magnetic polarity (one end being a north pole and the other a south pole). This is in agreement with the idea of magnetic flux lines emerging through the photosphere. A sunspot group is thus defined as that collection of sunspots that belong to the same outcropping of magnetic flux. This is not always an easy matter to determine.
When a spot becomes large enough it develops an egg like form. In the middle there is a very dark area, called the umbra, and around this is a lighter or grey area called the penumbra. In very large and complex groups, some of the large spots may consist of a penumbra that encloses two or even more penumbra (maybe the equivalent of a double yolker!). It is often regions containing these type of spots that show significant flare activity.
The growth of sunspot groups is described by the letters A,B,C,D,E,F and H. A through D describe different development phases, whereas E and F represent increases in size on the D phase. Phase H is the aged sunspot group, and represents the final decay phase of a large group.

Not all sunspot groups follow the same developmentary sequence. In some cases pores barely make it to an A group before disappearing back into the convective turbulence of the sun's outer layers within a few hours. Sometimes a collection of sunspots may grow into a C group and then decay back through the B and A phases within a few days. In a few cases a large region may rapidly grow to the D phase, increase in size through E and F, remain around for as long as a few months, and then decay to the H phase before final extinction into obscurity.
SUNSPOT MORPHOLOGY
Sunspots come in many shapes and sizes. Small sunspots tend to be circular in outline, but the larger ones may be symmetrical (circular) or asymmetrical (elongated). In area, spots may cover from 1 to 5000 millionths of the solar hemisphere. Some dimensions of sunspots are given in the table below.
 	SUNSPOT AREA	        DIAMETER	SUBTENDED ANGLE
    (mills hemis) (sq km)    (km)  (Earth=1)   AT EARTH (arc secs)

	   1	3x10E6	       2000     0.2		3
          10	3x10E7	       6000     0.5		8
         100	3x10E8	      20000     2	       28
        1000	3x10E9	      60000     5	       83
ANATOMY OF A LARGE SUNSPOT
 |
Relative Luminosities
Solar surface L=1 (temperature=6000K) Umbra L= 0.1 to 0.8 (0.3 is typical for a large umbra) Penumbra L= 0.7 to 0.8
Magnetic fields may reach up to 3500 Gauss in a large umbra |
Temperature is related to luminosity by the ratio (L1/L2) = (T1/T2)4.
|
Thus, a very dark umbra with a relative luminosity
Sunspots occur in groups, formed and linked by magnetic |
|
THE LIFETIME OF A SUNSPOT GROUP
Unlike the Earth, no surface feature on the sun lasts for any appreciable length of time. The most easily observed feature on the solar disc is the sunspot group, and most of these last for only a few days. The longest lasting sunspot groups are observable for no more than about 100 days, but these are very few and far between. Other solar features, such as prominences have similar lifetimes to sunspot groups.
The graph below was drawn from Royal Greenwich Observatory observations of over 3000 sunspot groups in the first half of last century.
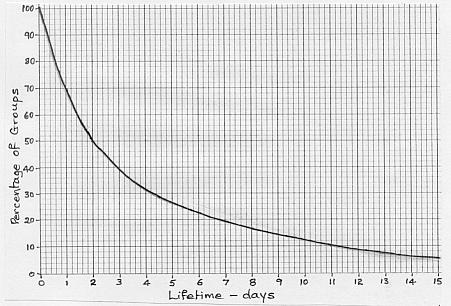
This may be interpreted by noting that the ordinate shows the percentage of sunspot groups that have lifetimes equal to or in excess of the interval shown on the abscissa. We can thus see that fully 50% of all groups have lifetimes less than 2 days (48 hours), and only 10% of groups last for more than 11 days.
It is interesting to note that on the average, larger sunspot groups last longer. The famous solar scientist Max Waldmeier derived a simple rule of thumb relating the lifetime of a sunspot group to the maximum area that it attains during its life:
where T is the group lifetime in days and Amax is the maximum area in millionths of the solar hemisphere (typically areas range from 1 to 5000 millionths). This can be useful in predicting the lifetime of a sunspot group as it will typically grow to maximum area much faster than it decays into oblivion. The formula, however, is only a rough guide, as wide individual variations occur.
SUNSPOT SURFACE DISTRIBUTION
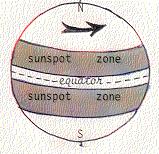
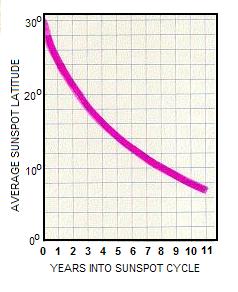
| Sunspots appear in bands parallel to the equator mostly between latitudes of 5o to 30o north or south of the equator. Very few spots are observed beyond 50o latitude and none beyond 55o. The average number of sunspots visible on the solar disc at any one time varies over the '11 year' sunspot cycle , and the average latitude at which these spots appear also varies over the cycle. At the start of a new cycle - defined as the time of sunspot cycle minimum - the majority of new sunspot groups form at latitudes of around 20 to 30o. There is then a slow decrease in the average latitude of formation throughout the cycle until at the time of the next minimum, the old groups are forming at around 5 deg latitude. |
 |
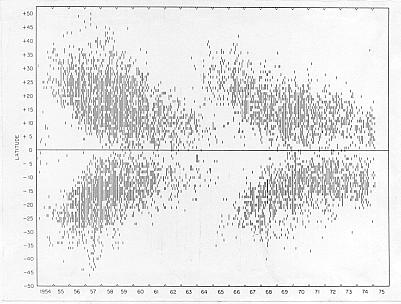
The whole process is illustrated very nicely by what is referred to as a Butterfly Diagram. This diagram (below) plots the latitude (ordinate) of each spot group against time (years). This shows the spot group behaviour for sunspot cycles 19 and 20.
The graph below plots the average latitude of a spot group a function of time after sunspot minimum. Note that this is only an average value, and the latitudinal distribution of sunspots at any time in the cycle can be quite large.
SUNSPOT MAGNETIC POLARITY
The overall solar magnetic field is believed to be composed of a large number of small but intense flux elements. However, when observed with a medium resolution magnetograph, the overall or average field is around 0.1 milliTesla ( 1 Gauss), which is about the same as the Earth's magnetic field. However, much higher fields (up to about 400 mT) are observed in certain parts of the solar disc. Most of these are associated with (and are believed to be responsible for) sunspot groups visible on the solar surface (photosphere). The magnetic polarity of the leader and follower sections of sunspot groups changes from one solar cycle to the next, and is also dependent on the hemisphere in which the group resides. The diagram below indicates the sense of the magnetic polarity for odd and even numbered sunspot cycles.
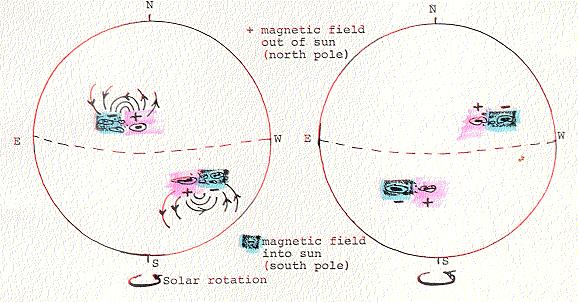
Because of this reversal of magnetic field polarity with cycle, it is sometimes said that the Sun has a 22 year magnetic cycle. Following this line of reasoning, it is felt by some that the sunspot characteristics of odd numbered cycles may be different from those of even numbered cycles. This may be partially true. However, when referring to a diagram plotting sunspot number versus time, it is wise to note that the dominant period lies around 1 year, not 22.
Note: A sunspot group moves from east to west at approximately 13 degrees per day (giving an average rotational period of about 27 days). (This is also about 0.55 degrees per hour). The leading section of a sunspot group is that on the western side (ie it leads the motion). The following or trailing section of the group is that to the eastern side.
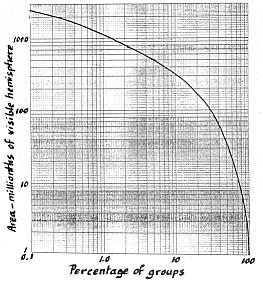
In general it may be said that the larger a sunspot, the greater the magnetic field. The following diagram indicates an average relationship between total spot area (penumbra + umbra) and maximum observable magnetic field (which is found near the centre of the umbra). Note however that this is a statistical average, and individual sunspots may show wide divergence from this graphical value.
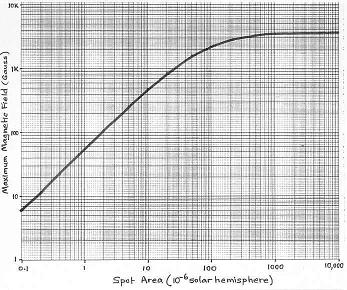
Note that the field initially follows a power law with an exponent just under 1, but begins to show saturation effects at spot sizes just under 100 hemispheric millionths, with a final saturation value of just under 4000 Gauss (400 milliTesla).
SUNSPOT NUMBER - DEFINITIONS AND DATA
The words 'sunspot number' have been used in the above discussion without a specific definition of what is meant by sunspot number. In fact, there are many definitions of sunspot number, and it is not always clear what definition is meant in a specific circumstance. It might be more appropriate to say that in fact there are many sunspot numbers. And none of these "sunspot numbers" are the actual number of sunspots on the Sun at any one time!
The following definitions will define the terms used in this paper.
Each day at many observatories around the world, a sunspot count will be made. Two vital numbers are recorded. These are the number of sunspot groups g, and the number of individual sunspot umbra u (See the appendices for a discussion on the difference between sunspots, penumbra and umbra). An uncorrected sunspot number is then computed according to the formula
Because each observatory uses different equipment with different resolutions, and each observer brings a different experience level to sunspot observation, a correction or standardisation factor k is applied to the uncorrected sunspot number to produce a 'corrected' sunspot number:
Because this sunspot number is calculated on a daily basis, the corrected value is also referred to as the daily sunspot number:
Note that this sunspot number is a number pertinent to a single observatory only. This number is almost never used by anyone for anything other than the computation of a monthly sunspot number. This monthly number is an average of all the daily values from several observatories and we will designate it SSNm.
There are two "yearly" sunspot numbers that are computed from the monthly values. One is simply an average of the monthly numbers according to the formula:
To be precise, this is how yearly sunspot numbers were computed prior to 1945. From 1945 to the present, yearly sunspot numbers are now actually calculated as the average of all the daily sunspot numbers during the year in question. The two methods produce very similar but not identical results.
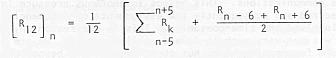
The other value is termed the smoothed sunspot number SSNs and this is determined by means of a running average according to the formula:

where the symbol R is used (as is frequently the case) to represent SSN. On the left hand side of the equation, R12 is used to denote SSNs, the smoothed sunspot number for month n (and centred on month n). The Ri on the right hand side of the equation are monthly sunspot numbers for the month i. Note that because 12 is an even number, to ensure that SSNs is based symmetrically about month n, it is necessary to use 13 months of data in the running average, although the division by 2 in the last term gives only half the weighting to the outlier months on each side of month n - that is, 12 months of "effective" data is used in the computation. See appendix A8 for more detail on the concept of this type of running average.
Note that SSSN is also sometimes used to designate the above Smoothed SunSpot Number.
Just to make matters even more interesting, we now need to consider who actually produces and distributes these sunspot numbers. In the beginning it was Rudolf Wolf at the Zurich Observatory who introduced the formula R = k ( 10g + u ) in 1848, and who applied it to older records at the observatory (from Zurich itself and other contributing observatories). Because of this, the sunspot number has also been referred to in the past as the Wolf (or Wolfe) number. Wolf was able to extend the sunspot series back to 1749 (monthly values). Yearly values (of lesser quality) were derived back to 1700.
The Zurich Observatory kept producing sunspot numbers until around 1980. The smoothed sunspot numbers from this sequence are normally designated Rz. About 1980, the director of the Zurich Observatory, Max Waldemeier decided that he didn't want to continue with the responsibility for producing this sunspot series, and the task was taken over by an Observatory in Brussels, and contributing observatories. The smoothed sunspot number from that time was then designated RI where the I stands for international. These numbers can be obtained from the SIDC (previously known as the Sunspot Index Data Centre but now known as the Solar Influences Data analysis Center) of the Royal Observatory of Belgium at
In the latter decades of the 20th century, delays in producing Rz and RI led to the introduction of another, more prompt sunspot number index. This was coordinated and produced by the American Association of Variable Star Observers and was referred to as Ra. With the introduction of the internet, the delay in the distribution of RI is now not a problem, although another source of confusion is that the SIDC releases both provisional and final sunspot numbers (and sometimes people initially using provisional values never get around to updating their research with the final values). However, for those wanting immediate access to sunspot numbers, the Space Environment Center in Boulder, Colorado, produces a sunspot number from a small number of solar observatories (including 3 USAF SOON observatories globally distributed). These numbers are essentially uncorrected (ie k = 1) averaged daily sunspot numbers from the observatories concerned, and as such are substantially different to, although highly correlated with, the Brussels numbers. The SEC numbers are often referred to as RSWO, as they are computed in the Space
Weather Operations centre of SEC. They are available on the web at around 0030 UT from the site
To add to the proliferation, some researchers like to monitor the sunspot numbers for the northern and southern solar hemispheres separately, and these are termed Rs and Rn, although without a second subscript, we are never always sure what integration period and method these numbers refer to. We should note that Rn + Rs = RI.
Finally we realise that observations of sunspots are often hampered by inclement weather, and although we might expect that with 82 contributing observatories, at least some of them should be able to observe sunspots at least once a day, there has been yet another sunspot number which is sometimes used and which does not depend on the observations of sunspots at all. This number relies on a high correlation that is observed between SSNs and F10.7 where the latter quantity is the observed solar radio flux density (at a distance of 1 AU from the Sun) at a frequency of 2800 MHz (ie a wavelength of 10.7 centimetres). A statistical relationship between the two quantities is used to produce an effective sunspot number R10.7 or sometimes Rf. It is interesting to note that Ra seems to follow Rf more closely than does RI.
In the analyses in the following sections, we will use the smoothed sunspot number SSNs which is in effect Rz or RI according to the time period, a quantity which some authors refer to as R12 as we noted in the defining equation above.
A list of yearly sunspot numbers SSNy given later are from Zurich and Brussels. A longer list of monthly sunspot number SSNm are from the same source, and a final data list of smoothed sunspot numbers SSNs are also given later. These then form the data from which we will analyse sunspot prediction methods. It should be noted that in this data set, values prior to 1849 are based on incomplete or missing data. In fact, many studies exclude sunspot cycles 1 to 7 because of this reason, and use data only from cycles 8 onward (which starts in November 1833).
Before proceeding to the next section, we should mention that in recent years, a new sunspot number was introduced by Hoyt and Schatten (1998). This number is sometimes referred to as
RG but this designation is ambiguous and I will use the term GSN (Group Sunspot Number),
because of course there are daily, monthly, yearly and smoothed GSN's. One might also use the
designation RGx where x is use to designate the specific GSN to which one refers. Anyway, the GSN is computed using only sunspot groups without reference to umbra (ie GSN = Κ g where
Κ is a normalisation factor to equate GSN to SSN over the years 1874 to 1976 when the Royal Greenwich Observatory issued daily reports on sunspots numbers).
The reason that the GSN was introduced in the first place was to try and reconstruct a longer historical data series of sunspot numbers. Prior to 1750, yearly SSN were available, but no monthly and smoothed SSN values. Hoyt and Schatten constructed a GSN series back to 1610, although with a lot of gaps up until 1795.
Hathaway, Wilson and Reichmann (2002) have done a relative study of GSN with SSN (although they computed smoothed SSN using not the conventional SSSN but a 24 month weighted Gaussian smoothing function to suppress "high frequency peaks .. (which) .. can give ambiguous results for the times and values of (sunspot minima and maxima)"). In their study they conclude that "the Group numbers are most useful for extending the sunspot cycle further back in time and thereby adding more cycles and improving the statistics. However, the Zurich numbers are slightly more useful for characterizing the on-going levels of solar activity". My summary of this conclusion is that the GSN does not offer any significant advantage that does the SSN for prediction purposes, and in fact may be worse (I see a contradiction in the statement that GSN provides better statistics,
while at the same it is less useful for "characterizing the on-going levels of solar activity". We shall not deal with GSN further in this paper.
In the following discussion we will initially consider a simplified method of computing the smoothed sunspot number. We will then discuss why the actual method is a little more complicated than the initial discussion.
Smoothed sunspot number is computed by averaging 12 months "worth" of monthly sunspot numbers. It is a number that is computed each month from the previous 6 months and the following 6 months of data. As a consequence, the smoothed sunspot number involves both past and future values. It is thus never available in real time, being always "6" months behind the times. Smoothed sunspot number has a much higher correlation with similarly smoothed upper atmospheric ionisation and neutral density (eg ionospheric frequencies, spacecraft drag) than do monthly value correlations. This is thought to be because all shorter term variations (that is, variations with periods much less than one year) which may have little to do with solar activity, are smoothed out.
Smoothed sunspot number can be thought of as coming from moving a window 12 months in length over the monthly sunspot data values. As you stop the centre of the window at each month in turn, you average the 12 monthly values that you can see within the window. This gives you the 'smoothed sunspot number' for that month. You then move the window along one month. This hides the last number on the left but uncovers one new value on the right. There are thus still 12 numbers within the window, and averaging these numbers gives the next month's smoothed sunspot number. Consider the process with the following diagrams. First we start with a horizontal tabulation of some monthly sunspot numbers:
Calculating the average we find a value of 12 for this time.
An astute person will note that we have been computing SSNs not for an exact month but for a time period between two months. This is because 12 is an even number, and we must thus have 6 months on each side of our middle arrow (ie our reference time). To ensure that the smoothed sunspot number falls exactly on a month (ie the middle of the month), we must have data symmetrically disposed about that month. The method that has been adopted to ensure that this happens while still using only 12 effective months of data can be seen in the actual formula used for SSNs computation:
SSNs = R12 is thus a running yearly average of the monthly sunspot number.
This report is concerned with sunspot number prediction. At present the most widely used sunspot number (with regard to prediction) is the Rz/RI/SSSN, smoothed in accordance with the aforementioned 13 month running average formula. Many prediction schemes have been developed based on the statistics of the SSSN time series (as given in appendix 11), and it is thus appropriate that we look at the statistics of this series (which covers the period from 1750 to 2003). To refer to individual cycles which occur in this series, a number has been assigned, starting from one SSSN minimum to the next, approximately 11 years latter. Cycle 1 is the designation given to the SSSN cycle starting in March 1755 and ending in June 1766. Subsequent cycles follow from that designation. Cycles prior to 1755 are given the numbers 0, -1, -2, etc as we go back in time.
Some researchers do not consider cycles before cycle 8 in their statistics, because they claim that these cycles are based on incomplete and missing. However, the shape of the SSSN curves are what turns more people away from these earlier cycles. Essentially the problem is that some of these cycles have rise times (from min to max) that are longer than their decay times. Because this behaviour has not been seen after cycle 7, it is felt that these earlier cycles are not true representations of sunspot behaviour, and that they should be discarded. This may or may not be true, depending on the nature of the processes that produce sunspots (see Prediction section). Cycle 8 and part of cycle 9 are also based on incomplete and missing data, but because they conform to the post-conceived idea of sunspot behaviour, they are normally judged as being "appropriate" cycles. The times of minimum and maximum are based solely on the time series, and thus may differ slightly from the official dates of sunspot cycle minimum and maximum (which have at times in the past been "adjusted" by individuals eg Waldmeier and more recently the Sunspot Cycle Consensus panel for cycle 23 minimum).
INDIVIDUAL CYCLE STATISTICS
The above table lists the parameters of the individual sunspot cycles. Times are all given in decimal years. The last two columns are the SSSN at the peak and start of the cycle respectively.
Thus we should note that the minimum SSSN value for a cycle is defined as being at the start of the cycle, which in turn is defined as going from one SSSN minimum to the next.
In the medieval world the Sun, through its power and brightness, was often associated with the Son of righteousness. World views then held that this orb was one of created perfection, and so in the early seventeenth century when Galileo proclaimed that through his telescope he had seen blemishes on the face of the Sun, this news was greeted with a censuring response. But from this time onward, man has been observing the solar disc almost continuously to appease his curiosity about the nature of sunspots and their relationship to the physical world.
It was not until 1869 that the first observations were made linking sunspots to events on the Earth. In this year two observers saw a flare in the vicinity of a large spot group, and noted a concurrent deflection of a terrestrial magnetometer trace, followed a few hours later by an enormous geomagnetic storm accompanied by massive auroral displays. From then onwards sunspots have become the scapegoat explanation for almost any phenomenon under the sun (pun intended). Besides both normal and extreme weather, diseases, animal populations, fertility and economic indicators have been tied to or predicted by the sunspot number.
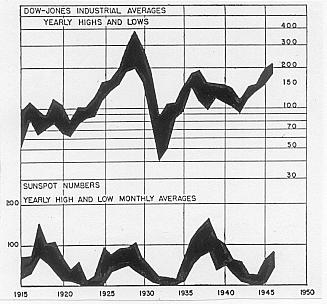
The diagram below from a 1947 book "Sunspots in Action" by an MIT physicist Harlan Stetson shows an attempt to link the sunspot cycle to the US Dow-Jones industrial index!
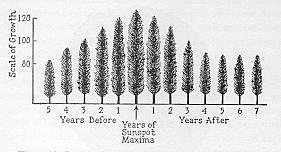
Another claiming sunspot number was causing variations in tree growth was made in 1931.
The field of sunspots and terrestrial weather is still is hotly debated topic and one that persists in the mind of the general public.
Despite there being little evidence for weather-sunspot correlation, in the third decade of the 20th century, a solid correlation was found between sunspots and radio propagation, and from that time the prediction of sunspot numbers became more than a scientific pastime. Most high frequency (HF) radio prediction programs use the sunspot number, either directly or indirectly somewhere in the prediction process.
The lower layers of the ionosphere can be described with good accuracy by the following expressions, which directly involve a sunspot number R:
Models involving satellite drag, decay and lifetime also may involve a quantity related to sunspot number. Prediction of satellite lifetimes in low Earth orbit is thus very much concerned (from a financial viewpoint among others) with predicting sunspots (or other solar parameters).
However, solar research has shown that of all the different features we observe on the sun, sunspots are probably the most benign. Even in the Earth's ionosphere where the sun exerts a major control, it is not sunspots that are responsible - even though there is a very high correlation between smoothed sunspot number and ionospheric indices. Rather it is ultraviolet and X-radiation emitted from areas of plage that is the causal agency. Sunspots are frequently present around plage areas, but plage can be observed in regions of the sun devoid of spots. The common factor is solar magnetic activity. This underlies nearly all solar processes. Sunspots themselves rarely 'cause' anything.
UNDERSTANDING SMOOTHED SUNSPOT NUMBER
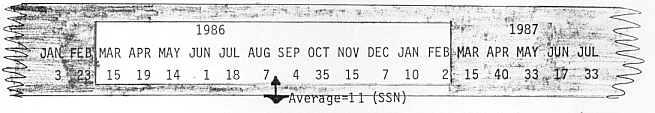
                        1986                                 1987
  JAN FEB MAR APR MAY JUN JUL AUG SEP OCT NOV DEC JAN FEB MAR APR MAY JUN JUL
    3  23  15  19  14   1  18   7   4  35  15   7  10   2  15  14  33  17  33
This shows the actual monthly average sunspot numbers from the beginning of 1986 to the middle of 1987. These are the values from which the smoothed sunspot numbers will be calculated. Now we will place a piece of cardboard with a '12 month window' cut out of it so that it is centred between AUG-SEP 1986 as shown below:

SUNSPOT CYCLE STATISTICS
Cycle   Start     Peak     End    Length   Rise  Decay    Max   Min
  1    1755.21  1761.46  1766.46   11.3     6.3    5.0   86.5   8.4
  2    1766.46  1769.71  1775.46    9.0     3.3    5.7  115.8  11.2
  3    1775.46  1778.38  1784.71    9.3     2.9    6.3  158.5   7.2
  4    1784.71  1787.80  1798.38   13.7     3.1   10.6  138.1   9.5
  5    1798.38  1805.13  1810.54   12.2     6.7    5.4   49.2   3.2
  6    1810.54  1816.38  1823.29   12.7     5.8    6.9   48.7   0.0
  7    1823.29  1829.88  1833.88   10.6     6.6    4.0   71.5   0.1
  8    1833.88  1837.21  1843.54    9.7     3.3    6.3  146.9   7.3
  9    1843.54  1848.13  1855.96   12.4     4.6    7.8  131.9  10.6
 10    1855.96  1860.13  1867.21   11.2     4.2    7.1   98.0   3.2
 11    1867.21  1870.63  1878.96   11.8     3.4    8.3  140.3   5.2
 12    1878.96  1883.96  1890.13   11.2     5.0    6.2   74.6   2.2
 13    1890.13  1894.05  1902.12   12.0     3.9    8.1   87.9   5.0
 14    1902.12  1906.12  1913.54   11.4     4.0    7.4   64.2   2.7
 15    1913.54  1917.62  1923.62   10.1     4.1    6.0  105.4   1.5
 16    1923.62  1928.29  1933.71   10.1     4.7    5.4   78.1   5.6
 17    1933.71  1937.29  1944.12   10.4     3.6    6.8  119.2   3.5
 18    1944.12  1947.37  1954.29   10.2     3.2    6.9  151.8   7.7
 19    1954.29  1958.20  1964.79   10.5     3.9    6.6  201.3   3.4
 20    1964.79  1968.87  1976.45   11.7     4.1    7.6  110.6   9.6
 21    1976.45  1979.96  1986.70   10.3     3.5    6.7  164.5  12.2
 22    1986.70  1989.54  1996.37    9.7     2.8    6.8  158.5  12.3
 23    1996.37  2000.29  2008.96   12.6     3.9    8.7  120.8   8.0
BULK CYCLE STATISTICS  (all available cycles  -  1 through 23)

Mean Cycle Length  (Min to Min)	  11.0 years
Mean Cycle Length (Max to Max)	  10.9 years
Mean Rise Time (start to peak)	   4.2 years
Mean Decay Time (peak to end)	   6.7 years
Mean Maximum SSSN	         113.1
Mean Minimum SSSN	           6.1


EXTREME CYCLE STATISTICS (all available cycles  -  1 through 23)

Shortest Cycle (Min to Min)	9.0 years	cycle 2
Shortest Cycle (Max to Max)	7.3 years	cycles 7-8
Shortest Rise Time		2.8 years	cycle 22
Shortest Decay Time		4.0 years	cycle 7
Longest Cycle (Min to Min)	13.7 years	cycle 4
Longest Cycle (Max to Max)	17.3 years	cycles 4-5
Longest Rise Time		6.7 years	cycle 5
Longest Decay Time		10.6 years	cycle 4
Largest Maximum SSSN		201		cycle 19
Smallest Maximum SSSN		49		cycles 5 & 6
Smallest Minimum SSSN		0		cycle 6
Largest Minimum SSSN		12.3		cycle 22
We note that with three exceptions, all records (extreme values) are held by cycles before 8. Although we should be wary of excluding cycles on this ground (else cycles 19 and 22 might be
similarly excluded), it may be of interest to recompute the above statistics with the first 7 cycles excluded from the data.
BULK CYCLE STATISTICS  (cycles  -  8 through 22)

Mean Cycle Length  (Min to Min)	 10.8 years
Mean Cycle Length (Max to Max)	 10.9 years
Mean Rise Time (start to peak)	 3.9 years
Mean Decay Time (peak to end)	 6.9 years
Mean Maximum SSSN		 122.1
Mean Minimum SSSN		 6.3


EXTREME CYCLE STATISTICS (cycles  -  8 through 22)

Shortest Cycle (Min to MIn)	9.7 years	cycle 22
Shortest Cycle (Max to Max)	9.0 years	cycles 16-17
Shortest Rise Time		2.8 years	cycle 22
Shortest Decay Time		5.4 years	cycle 16
Longest Cycle (Min to Min)	12.4 years	cycle 9
Longest Cycle (Max to Max)	13.3 years	cycles 11-12
Longest Rise Time		5.0 years	cycle 12
Longest Decay Time		8.3 years	cycle 11
Largest Maximum SSSN		201.3		cycle 19
Smallest Maximum SSSN		64.2		cycle 14
Smallest Minimum SSSN		3.2		cycle 10
Largest Minimum SSSN		12.3		cycle 22
SIGNIFICANCE OF SUNSPOTS
foE = 0.9 [ (180 + 1.44 R) cos χ ]0.25
foF1 = (4.3 + 0.01 R) cos0.2 χ
 Australian Space Academy