INTRODUCTION
An ionosonde is a radar instrument used to monitor the Earth's near-space environment, specifically the upper atmosphere between heights of around 100 to 500 km above the surface of the Earth. The information collected by this instrument not only gives us more information about our environment, but it is also used to support high frequency and satellite communications, over the horizon radar and radio astronomy. The ionosonde was one of the first radars to be developed - around 1930.
THE IONOSPHERE
The ionosphere is a region of the Earth's upper atmosphere that is ionised and thus exists as a plasma, the fourth state of matter. Ionisation is caused when ultraviolet and x-rays from the Sun remove electrons from the molecules of the atmosphere leaving ions. The electrons are then free to move around independently of the ions. Both the electrons and the ions can affect radio waves passing through the plasma area.
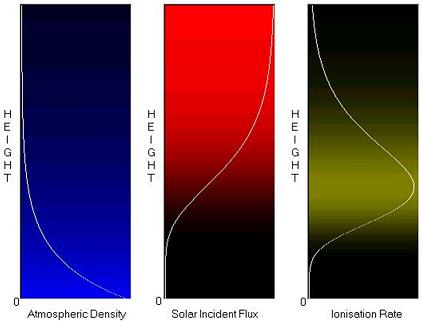
Specific frequencies of solar ultraviolet light and solar x-rays interact with different molecules in the Earth's upper atmosphere and produce a number of ionospheric layers or regions, which spread out over an altitude range of about 70 to 1000 km. (The ionosonde cannot measure the properties of the ionosphere over this entire range, but can measure the most important layers). The lowest part of the ionosphere is called the D-region and this occupies an altitude range from about 70 to 90 km. This region is responsible for absorption of low frequency radio waves. This layer almost totally disappears in the night-time. The next layer is called the E-layer and it exists around 100 to 120 km in height. It is strongest during the day, but at night-time a small remnant allows us to hear AM broadcast stations over long distances.
The main layer of the ionosphere is the F-layer and it exists both during the day and at night. In the daytime however, it splits into two sublayers, the F1 and F2. The F-layer covers the large altitude range from around 150 to 1000 km. The following diagram shows how each ionospheric layer is formed. As the solar UV hits the upper atmosphere, it gives up energy to ionise the molecules. This reduces its intensity.
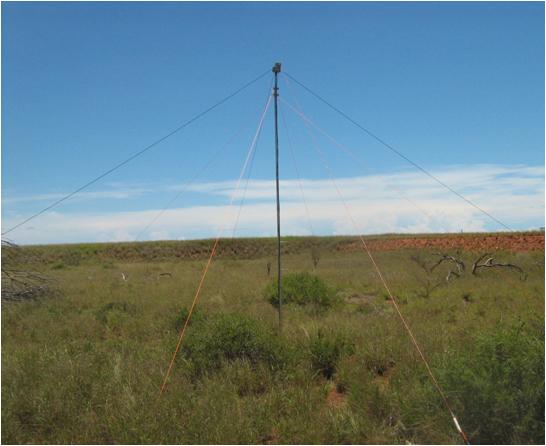
AN IONOSONDE
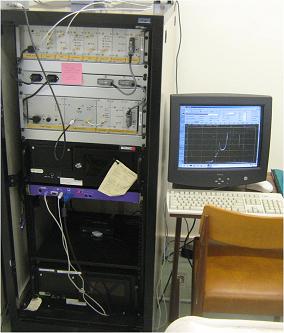
An ionosonde is a swept frequency vertical incidence high frequency radar. It consists of a transmitter, a receiver, a controller and a data processor, as shown in the diagram below.
The controller measures the time delay between transmitting a pulse and receiving its echo back from the ionosphere. This delay can be converted into a height.
AN IONOGRAM
The final output of the ionosonde is in the form of a graph termed an ionogram, which is a plot of ionospheric echoes as a function of height and frequency. An example is shown below.
An ionogram may then be used to compute a plot of the density of the plasma throughout the ionosphere. This type of plot is shown in the next image.
EFFECTS OF THE IONOSPHERE
An ionosonde is not only used in scientific research to measure and monitor the ionosphere. It is also used to support many applications that rely on or are affected by the ionosphere. These include shortwave broadcasting and high frequency communication, over the horizon radar systems and signal location (direction-finding), satellite communication and navigation, and radio astronomy.
High Frequency Communication
Although shortwave broadcasting is not important to most Australians, those who live in remote areas and many other countries rely on shortwave broadcast stations to provide their news and entertainment. Many Australian organisations also rely on high frequency communications (3 to 30 MHz) for their operations, particularly in remote parts of the country. These include the Royal Flying Doctor Service, state police and emergency services, and the Australian Defence Forces. International aviation carriers rely on HF for overseas flights.
Ionograms are used to compile data which allows the best frequencies to be advised to high frequency users, whether they be commercial, humanitarian or defence.
Over the Horizon Radar
Most radars are limited to line of sight. Over the horizon radar (OTHR) uses the ionosphere to see out to distances beyond 3000 km. This enables countries such as Australia, with vast borders and low population densities to provide wide scale surveillance coverage that would otherwise be unaffordable. The Australian JORN OTHR comprises three radar sites, one each in Queensland, Northern Territory and Western Australia to cover the vulnerable Australian coastline. Data is sent to a central monitoring site in South Australia. About a dozen ionosondes are used to support the JORN OTHR, as a precise knowledge of the ionosphere is required to make the best use of this type of radar.
Satellite Communications and Navigation
The ionosphere can cause a multitude of problems for signals that pass through it. The exact effects depend on the frequency, type of service and geographical location of the ground station. Equatorial and polar regions are especially affected.
Although the ionosphere is not essential for satellite communication and navigation, it can sometimes hamper it, and signals between a satellite and the ground must pass through the ionosphere. This is termed transionospheric communication. The ionosphere slows down any radio wave passing through it. This can affect the accuracy of satellite navigation, and indeed a GPS system that does not correct for ionospheric delay can show an error of up to 100 metres in extreme cases. The ionosphere can also attenuate lower microwave frequencies and rapid attenuation is termed scintillation. Such effects are not generally significant over the Australian continent, but have affected Australian defence satellite communications around the Arabian sea. The ionosphere will rotate the polarisation of linearly polarised satellite signals and this needs to be compensated for by rotating the antenna feed.
Radio Astronomy
Radio astronomers see the ionosphere as a problem, just as the lower atmosphere is a problem for optical astronomers. Ionospheric effects cause attenuation, refraction, dispersion, rotation and scintillation of celestial radio sources. This causes image degradation and distortion and can introduce artefacts into images unless very careful and extensive calibration procedures are followed. The ionosphere can also introduce radio frequency interference into a radio quiet zone from distant sources. Lower frequencies are affected more than higher frequencies. Some very low frequency (<20 MHz) radio astronomical observations are only possible from orbiting radio telescopes above the ionosphere.
 Australian Space Academy