by Mal Wilkinson and John Kennewell
An earlier version of the article presented here appeared in the July/August 1994 issue of the journal Southern Sky.
|
|
DETECTING JUPITER'S RADIO EMISSIONS
by Mal Wilkinson and John Kennewell |
Jupiter's sporadic radio emissions, first noted in 1955, can at times be very intense. In fact, they are exceeded in intensity only by strong solar radio bursts. Detectable in the short-wave radio band from 10 to 25 MHz, Jovian signals are an ideal source for a first project in radio astronomy.
Using only a dipole antenna and a communications receiver for audible monitoring, the equipment requirements are minimal. The key to success lies in knowing when to listen.
Particles spiralling along field lines in Jupiter's magnetosphere radiate electromagnetic energy as cyclotron and synchrotron emissions. These radiations are generally quite directional, leaving the vicinity of the planet in the form of narrow radio beams. At least seven different source have been identified. Some of these sources correlate with certain rotational alignments of the Jovian magnetic field while others are associated with both the alignment of the magnetic field and the position of the moon Io as seen from the Earth. The former are referred to as Io-independent sources, and are called Non-Io-B or Non-Io-A, for example, while the latter are designated Io-dependent and are known as Io-B or Io-A. Io's motion through the Jovian magnetosphere appears to influence both the intensity and the predictability of the emission. The most intense and therefore the most suitable source for amateur observation is the Io-dependent source Io-B. Fortuitously it is also the most predictable.
| As the moon Io moves through the magnetosphere of Jupiter, some of the most intense radio signals produced by the Jovian system are generated. In this image taken by the NASA Cassini spacecraft, Io lies in front of Jupiter and casts its shadow on the 'surface' of the planet. | 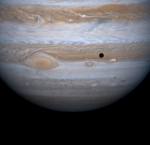
|
Most of the Jovian decametric radio emission (wavelengths in the tens of metres) observable with ground-based receiving equipment lies in the frequency range from about 4 to 39.5 MHz. Although the received intensities are maximum around 8 MHz and fall rather quickly above this frequency, most observations have been made in the frequency range of 15 MHz to 25 MHz where interference from shortwave radio stations is tolerable. Observations at frequencies approaching 4 MHz have been made when ionospheric conditions allow, around sunspot minimum.
There are two distinctly different types of radiation that have been observed - short (S) bursts of duration 1 to 10 milliseconds and long (L) bursts with durations of 0.5 to 5 seconds or longer. Some sources appear to produce only L-bursts while others such as Io-B and Io-C radiate a mixture of L and S-bursts. During a typical observing session many bursts of both types may be observed and the complete event is called a noise storm. The duration of these storms varies from perhaps only a few seconds to several hours.
Apart from their time duration, the main distinguishing characteristic of the two burst types is their frequency drift rate (figure 1). In the case of S-bursts this drift is apparently due to the fact that charged particles, originating at Jupiter, spiral out along Jupiter's magnetic field lines and mover into regions of progressively reducing magnetic field. The cyclotron frequency is directly proportional to the magnetic field strength, and thus the burst frequency changes to reflect the changing field. At 20 MHz, frequency drift rates for S-bursts are around -20 MHz/sec. The negative sign is used to indicate that the bursts atart at a high frequency and drift down to a lower frequency.
For L-bursts the frequency drift is related to complex geometric beaming effects associated with the cyclotron maser action believed to generate these emissions. In addition, diffraction effects imposed near Jupiter, which give rise to the modulation lanes (see figure 1) as well as other secondary scintillation effects due to the interplanetary medium and the Earth's ionosphere also modulate the emission. The modulation lanes appear in the radio frequency spectrum of L-bursts as regions of reduced signal amplitude with drift rates of typically +/- 100 kHz per second. The scintillation effects mentioned also produce a characteristic amplitude modulation of the bursts on a time scale of seconds.
Equipment Requirements
The signals from Io-B are quite intense in comparison to most radio-astronomical sources. When the Earth and Jupiter are near inferior conjunction, even a simple dipole will deliver around 1 μV peak to the antenna terminals of a receiver. The dipole should be folded to maximise its bandwidth, and elevated above the ground (or a suitable reflecting surface such as a metal roof) at a distance of between 1/4 and 3/8 of a wavelength. Small irregularities such as corrugations in this surface will not affect performance unless they exceed a depth of approximately 1/10 of a wavelength at the observing frequency. The exact height of the dipole does affect the response pattern of the antenna, and use can be made of this fact to maximise the antenna gain in the direction of the planet.
If Jupiter has an elevation angle of less than 50o when it crosses the meridian at the observing site, a dipole height of 3/8 of a wavelength is appropriate. For elevation angles exceeding 50o, the height should be 1/4 of a wavelength. The dipole should generally be mounted in an east-west direction, and as clear of obstructions as possible. If the observing latitude is such that Jupiter crosses the meridian within about 20o of the zenith, a north-south orientation might give a better coverage. Either way, it should certainly have a diect line of sight to the planet. Construction details of an appropriate antenna for use at 20 MHz are shown in figure 2. When the planet is at elevation angles below 30o use of a typical radio amateur 21 MHz beam antenna (if available) may be appropriate.
Most general purpose communication receivers should be adequate to amplify and make audible the Jovian signals collected by the above dipole antenna. Receiver stability is not very important, but minimum useable sensitivity should be less than 1 μV for a 10 dB signal to noise ratio in the AM mode. The receiver bandwidth should typically be 5 to 10 kHz. Bandwidths up to 30 kHz are ideal , but not very common, whereas narrow (2 kHz) bandwidths associated with specialised amateur SSB transceivers may be a little on the low side. The antenna is connected to the receiver via a length of 75 Ω (ohm) coaxial cable. This requires a balun (4:1 impedance ratio) to match the antenna impedance of 300 Ω to the 75 Ω coaxial line (figure 2).
The coaxial line should terminate in a plug compatible with the receiver 75 Ω (or 50 Ω) antenna input. For simple audible monitoring of the receiver no further equipment is required. Many observers will probably wish to record signals for future use. This can be done by connecting a cassette tape recorder to the receiver headphone jack (figure 3). A further option would be to connect a chart recorder to the receiver detector output. This however, involves getting into the receiver electronics, and should only be undertaken by those experienced in such matters.
Once all the equipment has been set up if is then a matter of listening for the signals. Random monitoring however, is not very profitable, and many a person has been disillusioned through this mode of operation. Due to the directional nature of the radiation, there are certain well-defined time slots (windows) during which signals from the Io-related sources are strongest and have the greatest probability of occurence. These windows can be computed fairly readily from a few requirements.
Improving the Odds
The first and most obvious requirement is that both Jupiter and the Earth should be on the same side of the Sun. Larger signals result when the distance between source and receiver is smallest. The largest signals can thus be expected at inferior conjunction of the two planets. The remaining requirements concern the position of Io and the rotational alignment of Jupiter with respect to the Earth. The position or phase of Io (γIo) is measured counterclockwise around its orbit from Superior Geocentric Conjunction (SGC) (see figure 4). SGC is the point on the far side of the orbit which is exactly opposite the direction line from Jupiter to Earth. The window for bursts from the Io-B radio source occurs when Io lies betweeb 65o and 110o from SGC and when the longitude of the Jovian central meridian (CML), measured in system III (refer to note 1 on Jovian longitude measurement), lies within the range 95o to 195o. For detectable signals we thus need to satisfy the conditions for γIo and CML(III) simultaneously (see figure 4). These conditions occur every few days, but signals are generally only observable from a particular site on Earth about once per week, with particularly strong events occurring perhaps once per month. Figure 5 shows the conditions for radio emissions from not only the Io-B source but also three other sources designated Io-A, Non-Io-A and Io-C. Note that for each source there is an area of high probability of emission surrounded by an area of reduced probability.
To compute the occurrence of Jovian radio emission we need four pieces of information. We first assume that Io moves in a circular orbit (a good approximation) with a synodic period of (ie as observed from Earth) of 1.769860 days. Times of SGC are then obtained from the Astronomical Ephemeris and thus we can determine the required times for which γIo lies between the specified values. The next step is to note that the rotation period for system III longitudes is 9 hours 55 minutes 29.71 seconds. Again the ephemeris can be consulted to find CML(III) values for 0000 hours UTC on each day of the year (eg in 1983 on December 1st at 0000 UT the CML (system III) was 218.9o). It is now possible to find the times when CML(III) lies between its specified values. A calculator can be used to find when both conditions are satisfied simultaneously.
Alternatively, a computer program containing Jovian and Io emphemerides may be used to produce a yearly listing for various observer sites. Such a program is listed in figure 6A. This program written in QBASIC, will print out the dates and times of predicted emission for the three Io-related sources Io-A, Io-B and Io-C. These times are for the high probability 'core' areas. Using data from figure 5 the program can easily be altered to include lower probability conditions or the Io-independent source Non-Io-A. Time resolution can also be increase by changing the line "th=th+0.5" to read "th=th+0.1". The program will then step through in 0.1 hour time increments. It will also take longer to produce a printout and use more paper. Note that this is a global program and Jupiter will not be visible above the local horizon for all the times printed out. It is necessary to use this information together with the times of rising and setting of Jupiter at your location.
'Program to flag Jovian Decametric windows m$ = "JANFEBMARAPRMAYJUNJULAUGSEPOCTNOVDEC" wi = 42.46 / 360 pi = 3.141593 kr = pi / 180 f$ = "### \ \ ## ##.# ### ### ##.## \ \" OPEN "jovrad.txt" FOR OUTPUT AS #1 INPUT "Year for which predictions are required"; yy e = INT((yy - 1) / 100) f = 2 - e + INT(e / 4) jd = INT(365.25 * (yy - 1)) + 1721423 + f + .5 d0 = jd - 2435108 incr = 0 IF yy / 400 - INT(yy / 400) = 0 THEN incr = 1 yyly = yy / 4 - INT(yy / 4) yylc = yy / 100 - INT(yy / 100) IF yyly = 0 AND yylc <> 0 THEN incr = 1 ty = 59 + incr dmax = 365 + incr tx = ty + .5 PRINT #1, "******************************************************" PRINT #1, " JOVIAN IO-DECAMETRIC EMISSION PREDICTIONS FOR"; yy PRINT #1, "******************************************************" PRINT #1, PRINT #1, "Day Date Hr(UT) Io_Phase CML Dist(AU) Source" PRINT #1, th = 0 DO GOSUB Compute s$ = "" IF L3 < 255 AND L3 > 200 AND U1 < 250 AND U1 > 220 THEN s$ = "Io-A" IF L3 < 180 AND L3 > 105 AND U1 < 100 AND U1 > 80 THEN s$ = "Io-B" IF L3 < 350 AND L3 > 300 AND U1 < 250 AND U1 > 230 THEN s$ = "Io-C" IF s$ <> "" THEN GOSUB Outdat th = th + .5 LOOP UNTIL INT(th / 24) + 1 > dmax PRINT "Program completed - results in file JOVRAD.TXT" END Compute: d = d0 + th / 24 v = (157.0456 + .0011159# * d) MOD 360 m = (357.2148 + .9856003# * d) MOD 360 n = (94.3455 + .0830853# * d + .33 * SIN(kr * v)) MOD 360 j = (351.4266 + .9025179# * d - .33 * SIN(kr * v)) MOD 360 a = 1.916 * SIN(kr * m) + .02 * SIN(kr * 2 * m) b = 5.552 * SIN(kr * n) + .167 * SIN(kr * 2 * n) k = j + a - b r = 1.00014 - .01672 * COS(kr * m) - .00014 * COS(kr * 2 * m) re = 5.20867 - .25192 * COS(kr * n) - .0061 * COS(kr * 2 * n) dt = SQR(re * re + r * r - 2 * re * r * COS(kr * k)) sp = r * SIN(kr * k) / dt ps = sp / .017452 dl = d - dt / 173 pb = ps - b xi = 150.4529 * INT(dl) + 870.4529 * (dl - INT(dl)) L3 = (274.319 + pb + xi + .01016 * 51) MOD 360 U1 = 101.5265 + 203.405863# * dl + pb U2 = 67.81114 + 101.291632# * dl + pb z = (2 * (U1 - U2)) MOD 360 U1 = U1 + .472 * SIN(kr * z) U1 = (U1 + 180) MOD 360 RETURN Outdat: dy = INT(th / 24) + 1 h = th - (dy - 1) * 24 IF dy > ty THEN m = INT((dy - tx) / 30.6) + 3 da = dy - ty - INT((m - 3) * 30.6 + .5) ELSE m = INT((dy - 1) / 31) + 1 da = dy - (m - 1) * 31 END IF mn$ = MID$(m$, (m - 1) * 3 + 1, 3) PRINT #1, USING f$; dy; mn$; da; h; U1; L3; dt; s$ RETURN |
****************************************************** JOVIAN IO-DECAMETRIC EMISSION PREDICTIONS FOR 1994 ****************************************************** Day Date Hr(UT) Io_Phase CML Dist(AU) Source 4 JAN 4 11.0 228 205 5.81 Io-A 4 JAN 4 11.5 233 224 5.81 Io-A 4 JAN 4 12.0 237 242 5.81 Io-A 6 JAN 6 6.0 233 325 5.78 Io-C 6 JAN 6 6.5 237 343 5.78 Io-C 7 JAN 7 6.5 81 133 5.76 Io-B 7 JAN 7 7.0 86 152 5.76 Io-B 7 JAN 7 7.5 90 170 5.76 Io-B 9 JAN 9 20.0 241 203 5.73 Io-A 9 JAN 9 20.5 246 222 5.73 Io-A 11 JAN 11 12.5 225 232 5.70 Io-A 11 JAN 11 13.0 229 251 5.70 Io-A 11 JAN 11 14.5 242 305 5.70 Io-C 11 JAN 11 15.0 246 323 5.70 Io-C 12 JAN 12 15.0 90 113 5.68 Io-B 12 JAN 12 15.5 94 131 5.68 Io-B 12 JAN 12 16.0 98 150 5.68 Io-B 14 JAN 14 8.5 82 179 5.66 Io-B 16 JAN 16 21.0 234 214 5.61 Io-A 16 JAN 16 21.5 238 232 5.61 Io-A 16 JAN 16 22.0 242 250 5.61 Io-A 18 JAN 18 15.5 234 315 5.59 Io-C 18 JAN 18 16.0 238 333 5.59 Io-C 19 JAN 19 16.0 82 124 5.57 Io-B 19 JAN 19 16.5 86 142 5.57 Io-B 19 JAN 19 17.0 91 160 5.57 Io-B 19 JAN 19 17.5 95 178 5.57 Io-B |
Listening for Jupiter
After the equipment has been assembled and the appropriate times computed, all that remains is to turn on the receiver in the AM mode with the RF sensitivity on maximum, turn off the AGC is possible, tune to a clear spot around 20 MHz and listen for the bursts. This is not as easy as it may first appear. The signals that we are searching for are only a little above the background cosmic noise (which should be well above the internal receiver noise level). Powerline and automobile ignition interference can both conspire to make signal recognition difficult. It is usually helpful in this respect to observe in the early morning hours until some experience is gained in discriminating between local interference and Jovian signals. Fortunately, the signals are generally observable over a range of several megahertz so that small changes in the observing frequency can often be made to find a frequency which is free from interference. As an additional aid, some communication receivers are equipped with a noise blanker which can be very effective in eliminating certain types of impulsive interference such as ignition noise.
As previously mentioned, there are two types of signal that may appear (the L and S bursts). Verbal descriptions of how these sound vary from observer to observer. The L bursts have been described as having a 'swishing' sound or as 'waves crashing on a beach'. At times the sound has more of a 'ker-ash' quality, softer verion of a mid-distant terrestrial lightning discharge. Care must of course be taken to avoid misidentification with terrestrial electrical storms. A good check is to listen on an AM broadcast band receiver (530 - 1620 kHz) to preclude such misidentification. The S bursts occur less often than L-bursts and are considerably shorter in duration; typical single frequency durations are less than 10 ms. When heard on a communications receiver S-bursts have a 'chuff-chuff-chuff' type of sound with recurrence rates of between 10 and 40 per second. The bursts tend to occur in groups several seconds in duration. Probably the only way to be absolutely certain that you have heard Jupiter signals is to compare them with known signals (see note 4).
Occasionally even with the best equipment, and under optimum conditions, no signal will be heard. This may be due to a high local interference level, or it may be that no signals are being generated at the time. The absolute probability of receiving signals appears to vary with declination of the Earth as seen from Jupiter. In mid-1994, this value is near its most negative value, and emission probabilities are lower (particularly for the Non-Io related sources) than they are expected to be in a few years time when the declination is closer to zero. This variation of declination, which seems to determine the reception probability and the received signal strength, has a period of about 11.8 years. This fact initially led to a belief that Jovian signals were correlated with the 11 year solar cycle. There is still work to be done in sorting out geometrical effects from solar influences on Jupiter's radio signals.
There is one further influence on the reception of Jovian decametric signals, and that is due to the effect of Earth's ionosphere on the propagation of radio waves. The ionosphere is a region of charged particles extending from about 80 to 500 km above the Earth's surface. This region is essentially opaque to all radio waves below a critical frequency. Radio waves with a frequency above this limit can penetrate the ionosphere and reach the antenna below. The minimum penetration frequency lies in the range from about 2 to 50 MHz and depends on many factors. The most important are the latitude of the observing site, the time of day, the season, the level of solar activity, and the angle at which the signal is incident on the ionosphere.
Solar Influence
In broad terms, the penetration frequency will be higher the closer the Sun is to the point at which the incoming wave penetrates the ionosphere, and the higher the level of solar activity (measured roughly by the smoothed sunspot number). The penetration frequency also increases with decreasing elevation of the astronomical source. As a very rough guide, it is probably safe to say than around the time of sunspot minimum, observations of Jupiter made at night, where the elevation of the planet exceeds 20o will always experience a transparent ionosphere at a frequency of 20 MHz. However, low elevation observations made during daylight hours may be blocked at this frequency. Users of low elevation beam antennas should be particularly aware of this effect.
The first positive identification of radio signals from another planet is of course an exciting event. Many observers may be content with this achievement: a proof of concept so to speak. Others however, may want to pursue the subject further. For those who want to try to listen and identify the other Jovian sources such as No-Io-A for example, an improvement in system sensitivity is probably desirable. Little, however, can be done in the way of electronic amplification although a preamplifier with a gain of around 10 decibels (dB) may help improve a marginal communications receiver (higher gains will generally lead to many other problems at these frequencies), but in most cases the background cosmic 'noise' radiation incident on the antenna is already well above the internally-produced receiver noise. The only way to improve the system performance is to increase the antenna gain in the direction of Jupiter. This automatically implies a narrower antenna beamwidth, and thus the radio of Jovian noise to cosmic noise is increased. Suitable higher gain antennas are a 2, 3 or 4 element yagi, a cubical quad, a corner reflector, or an array of several dipoles. Because of their narrower beamwidth these antennas will need to be steerable. Details in the construction of these antennas can be obtained from one of many antenna handbooks (see note 2), The main factor which limits construction of high gain antennas is that of size.
Antennas at 20 MHz are unfortunately quite large and need correspondingly large amounts of space for their erection. Other projects which might be investigated are correlation of Jupiter bursts (either occurrence or intensity) with solar activity. When a Jovian orbital spacecraft (such as the Galileo probe)allows continuous monitoring of the Jovian environmental conditions, including Io vulcanism, there is no lack of correlative material.
Summary
The equipment described here to monitor Jupiter radio bursts forms a simple radio telescope. It can also be used to detect radio emission from our galactic centre (figure 7). It can be put together with minimal effort using readily available parts and forms an ideal introduction as a first project in radio astronomy. For those who want to pursue further work in the field, there are many opportunities. Avenues include the monitoring of solar bursts, interferometry, and the production of radio maps of the sky at various frequencies. Most of these require more extensive equipment and expertise. Experience gained in the domain of Jovian emissions provides a good basis for continued efforts. Success gained here can instill the confidence required to continue in these exciting areas, which so far have seen little sustained activity from individuals isolated from the larger radio astronomy groups.

Notes
1 Jupiter is not a solid body and all its parts do not rotate at the same speed. Equatorial reqions rotate at a larger angular velocity than do the polar regions. It has been found necessary to employ three systems of longitude to describe Jupiter's rotational motion. System I is used for equatorial surface latitudes, system II is used for surface latitudes greater than 10o, and system III is used to describe the motion of the Jovian magnetosphere. Because the magnetic field is probably generated within the core, it is thought that system III also describes the rotation of the planetary core.
2 Several antenna books give further information on antennas and balun construction. One excellent text is: ARRL Antenna Book, G L Hall (ed), American Radio Relay League, Newington, CT, 06111, USA (1983).
3 A good general text on radio astronomy which also discusses Jovian emissions is: Radio Astronomy (2nd edition), John Kraus, Cygnus-Quasar Books (1986).
4 Several web sites have audio files with Jovian decametric sounds observed at a single frequency. These are very useful aids to identify and distinguish the desired signals from interference and other electromagnetic noises. The RadioSky site contains separate .WAV files for L-bursts and S-bursts.
5 Radio Jove is a NASA sponsored educational radio astronomy program which makes available a kit radio designed by Richard Flagg specifically for Jovian decametric signal monitoring. Information can by obtained at the Radio Jove website.
6 An Australian design for a receiver to monitor Jupiter's radio emissions was presented by Jamieson Rowe in the August 2008 issue of the magazine Silicon Chip. This is a superheterodyne receiver, unlike the Radio Jove receiver which is a 'direct conversion' design. As of 2009 the Australian electronics firm Altronics produces a kit for this receiver which sells for about $A85.
Australian Space Academy
 Home
Home