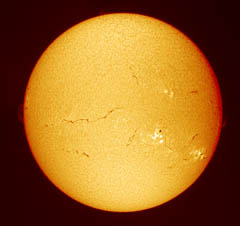
Solar flares are seen from the ground in the light of
the hydrogen alpha spectral line. Credit: BBSO
The material here is a modified form of an invited student tutorial presented by the author at the Conference on Solar and Terrestrial Physics (STEP 1995) held at the University of Adelaide from 25 to 29 September 1995.
1 INTRODUCTION
The concept of space weather, although not a new one (see Kennewell, 1984), has recently risen to prominence as an overview term for the processes that occur in and give rise to the space environment. It encompasses all of solar-terrestrial physics, and particularly includes the applications arena wherein our hi-tech and space systems both use and are affected by the space environment.
The current emphasis on the term 'space weather' originated in the USA, culminating in a National Space Weather Program. The aim of this drive is to raise the profile of space environmental studies and services, to educate, to unite more closely a diverse community, and to produce the visibility and understanding necessary for successful funding of a suite of viable programs.
|
SOME DEFINITIONS OF SPACE WEATHER
From the US National Space Weather Program "Space Weather" refers to conditions on the Sun and in the solar wind, magnetosphere, ionosphere, and thermosphere that can influence the performance and reliability of space-borne and ground based technological systems and endanger human life. Adverse conditions in the space environment can cause disruption of satellite operations, communications, navigation, and electric power distribution grids, leading to a panoply of socio-economic losses. A Physicist's Viewpoint Space weather is the application of space environmental studies to the interactions that occur between the space environment and the activities of humankind. A Personal Viewpoint Space weather is the state of the space environment, the appreciation of that environment and the effects that environment has on our activities and ourselves. |
2 THE SCOPE OF SPACE WEATHER
2.1 Solar Driven Space Weather
The primary driver for most of our space weather is the Sun. Processes within this star give rise to phenomenon that travel outward through the interplanetary medium and which, if travelling in the right direction, may couple into the Earth's magnetosphere and ionosphere.
On a calm day the solar output ranges across the electromagnetic spectrum. The emission peaks around 500nm in the visible spectrum, and extends at decreasing intensity into the lowest reaches of the radio spectrum and into the X-ray spectrum. On Earth, the heat and light make all biological life (the ecosphere) possible. The UV and X-ray emission are absorbed at various heights in the atmosphere, giving rise to the ozone layer and the ionosphere. The latter is used for communications, navigation and remote sensing.
Particulate radiation is also emitted by the Sun, principally due to the million Kelvin solar corona (outer atmosphere). These particles, typically electrons and hydrogen and helium nuclei, travel out through the interplanetary medium as the solar wind, with an average speed of 400 km/sec. At this speed the wind is hypersonic with respect to the Earth and a bow shock wave is set up. The Earth's magnetic field is altered through this interaction forming the well known magnetospheric shape. This magnetosphere acts as a partial shield to incident particulate radiation, but allows greater access to Earth at the polar cusp, and via the magnetotail for low energy particles.
In quiet conditions solar particle energies are generally less than about 1 MeV. At Earth they produce radiation belts with ring currents girding the planet. On the ground the diurnal variation can be measured in the geomagnetic field.
Both the e.m. and particulate radiation from the Sun vary in space and time. Temporal variations have periods of milliseconds to hundreds of years. One prominent variation, involving the manifestation of dark spots on the solar disc, has a period of about 11 years. For much of space weather, this period is a dominant one.
We currently believe that magnetic fields within the Sun are the controlling elements of solar weather. These give rise to the phenomena of sunspots, plage, filaments and coronal holes. They are also responsible for the solar activities discussed below. On a stormy day, the Sun's output in the radio and X-ray spectrum can increase by several orders of magnitude. Radio energy can cause interference to sensitive systems, particularly wide beamwidth, low link margin satellite L-band mobile communication systems. The X-ray increase causes a 'thickening' of the lower ionosphere that effectively absorbs most of the high frequency (HF) radio energy incident upon it. This may effectively destroy all short wave communications, interfere with some navigation systems and blanket over the horizon (OTH) radar systems. Increases in the total electron content of the higher ionospheric layers can reduce the precision of the GPS navigation system, and even in certain parts of the world, render satellite communication unusable due to ionospheric scintillation. Space tracking systems experience ranging and positioning errors.
Explosive events that occur on the Sun are powered by reconfiguration of solar magnetic fields (eg magnetic reconnection). These include flares, coronal mass ejections and solar particle events.
Solar flares are abrupt increases in electromagnetic radiation, most notably in the radio and X-ray regions of the spectrum. Total energy release in large solar flares may exceed 1027 Joule (equivalent to 200,000 million megatons of TNT). The X-ray energy causes increased ionisation and warming at the base of the thermosphere (~100km), and the radio energy can interfere with a multitude of Earth and space-based sensors and systems.
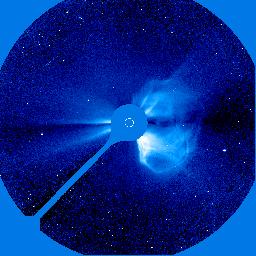
Coronal mass ejections (CMEs) are the acceleration and release of giant clouds of plasma containing low energy particles. The plasma in these clouds constrains and carries some of the solar magnetic fields. The fields are effectively frozen into the plasma. The mass of a large CME can exceed five billion tons, and the energy associated with the largest CMEs is comparable to the energy associated with the largest flares.
Arriving at the Earth's orbit these plasma clouds compress the Earth's magnetosphere. At times the magnetosphere may be compressed below geosynchronous orbit, exposing satellites there to the direct solar wind. If the interplanetary magnetic field is directed south, large quantities of low energy particles (electrons and protons) may be injected into the magnetosphere, especially at the magnetotail. This results in the expansion of the auroral oval equatorward. High fluxes of electrons can cause severe satellite differential charging and deep dielectric charging. Subsequent discharges can destroy satellite systems.
Magnetic and ionospheric storms can disrupt communications, navigation and other systems over a wide area for many days. If the rate of change of the magnetic field is great enough, currents may be induced in long cables and pipelines, causing disruption to power services, damage to equipment, and corrosion in metallic pipes. Some believe that animal navigation and migration dependent on the geomagnetic field may also be affected.
Solar particle events (SPEs/SEPs) release large numbers of high energy (relativistic) particles, predominantly protons with energies up to 1 GeV. These particles may arrive at the Earth within a few tens of minutes and can degrade solar cells, cause computer memory upsets, and pose a severe radiation danger to men and machines in vast areas of space. The highest energy SPE events can be detected at ground level (GLEs) and can cause significant radiation increases at aircraft cruise altitudes. They may well prove to be a limiting factor in manned exploration of the planets.
The relationship between the three solar energetic phenomena is still a matter of lively debate. The largest magnetic reconfiguration events tend to produce all three, but smaller energy releases may result in only a flare or only a CME.
SPEs are the most dangerous and damaging of all solar energetic activity, and are fortunately the most rare.
2.2 Extrasolar Space Weather
The Sun is the major, but not the only source of space weather. Galactic cosmic radiation has been known and studied for many decades.
Meteor burst communication is currently used in a number of applications where traditional ionospheric or satellite communications are not appropriate. On the debit side, a large influx of meteoric material can seriously degrade the operation of an OTH radar system.
Small meteoriods (the interplanetary body that produces the meteor phenomenon) pose a small hazard to satellites and spacecraft (particularly large long lived operations), although man-made orbital space debris is now a more significant hazard.
Much larger individual meteoroids (>100m) can pose a hazard to the ecosystem, and bodies larger than 1 km hold the import of global catastrophe (Steel, 1995).
There is evidence that extrasolar X-ray and gamma ray sources may produce a measurable increase in the lower ionosphere, an increase detectable in VLF signal propagation. There is also growing satellite sensor evidence that our magnetosphere contains nuclei and ions initially injected into the heliosphere as it ploughs through the periphery of a giant interstellar cloud.
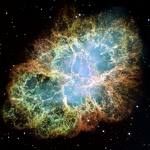 |
A supernova occurring anywhere within a thousand parsecs of the solar system could create very stormy weather indeed, and would make life on the Earth quite uncomfortable. |
A recent speculation on the nature of the enigmatic gamma-ray bursts ascribed them to the merging of neutron stars in binary systems. If such a collision were to happen in our galaxy, the intense gamma-ray influx to the lower mesosphere and stratosphere may produce enough nitric oxide to totally destroy the ozone layer, and enough nitric acid to produce years of high level acid rain.
There is indeed more to space weather than what is under the Sun!
3 AN INTEGRATED OVERVIEW
Provision of a Space Weather Service is essentially one of being able to specify, both for the present and into the future, the energy, mass and momentum fields throughout the near space environment. That environment is currently of interest for the Sun to the Earth, but even today, occasionally requires specification past the Earth, to Mars and even to the outer solar system.
We observe, and our observations are a basic input for our research. Guided by physical laws and a measure of our own speculation, the research leads to understanding. Understanding gives us models to attempt prediction, and it also guides the development of instrumentation to extend our observational capabilities.
The observations simultaneously allow a real-time Space Weather Patrol. This allows nowcasting, and together with the models, forecasting of the space environment for a diverse array of customers whose systems operate by, through, and in that environment.
An essential part of this process, if it is to be successful, is feedback between each group. Forecasters need the researchers, but researchers must monitor the forecast output to validate and refine models. Customer - forecaster - researcher interaction is required for each to be able to understand specific system-environment interactions. The customer must be able to interpret the forecast, understand the consequences, and maximise system function. The forecaster and researcher need to tailor model outputs for the specific situation. This whole area is one that deserves more attention. It is an essential directive for a successful Space Weather Service. It need not be restrictive upon researchers. New areas of exploration should ideally precede and anticipate customer demand, but in reality, system interactions can also lead to unexpected phenomena demanding investigation.
4 BASIC SPACE PHYSICS
There are, of course, a wide range of physical laws that govern the behaviour of the matter and energy that pass through, interact in, and constitute the space environment. Each specialist undoubtedly has his or her favourite equations, and en masse these present a formidable barrier to the novice space meteorologist. There are however, a few simple relationships which help us to distinguish and understand general types of space environmental behaviour.
4.1 The PB Ratio
The space environment is permeated by plasma and magnetic fields. The behaviour of this combination can be dichotomised by a ratio (which we shall term PB) of the plasma kinetic energy density to the magnetic field energy density:
4.2 Plasma Frequency
This relationship crops up all over the place. It is equally pertinent in the solar corona as in the Earth's ionosphere. It allows the interpretation of a multitude of phenomena and governs the allowable operation of several systems. The fundamental plasma frequency (also known as the plasma critical frequency) is given by:
4.3 Particle Motions
The magnetosphere is one of the most important areas of space environment research and space weather effects.
The Earth's magnetic field acts like a giant cocoon, to shield us from much of the ambient space radiation. However, not only very high energy particles can penetrate this defence, but vast clouds of low energy material can break through the back door of this shield.
The fundamental equation describing the motion of charged particles in a magnetic field is the Lorentz force equation, which when combined with Newton's second law of motion can be written:
5 GRAPHICAL VISUALISATION
The presentation of sensor data and the visualisation of model output is an extremely important component of space weather. Even more than with terrestrial weather, we are dealing with a 'deep' three dimensional environment. Numerous time varying fields exist throughout this environment. Sensors are scarce, and data points must often be used as very limited boundary inputs to a model that is expected to extrapolate behaviour over an incredibly large volume.
It is very easy to develop tunnel vision in a field such as this. Extensive graphical visualisation is often the key to assist researchers and particularly forecasters come to grips with the nature of the spatial and temporal variations. In real-time customer support, it is absolutely vital to be able to sort out the 'signal' from the noise. What is noise to one system may be all important to another. Dynamic integrated displays giving a situational overview with rapid recognition when parameters exceed preset event thresholds are most desirable.
Visualisation is not only important, but is usually responsible for vastly more lines of computer code and computer time than the basic model whose output is displayed. In the mid 1990's the US Air Force awarded a multimillion dollar contract to a commercial firm purely for graphical visualisation of model at a space forecast centre in Colorado. In at least one of the programs, the actual model could be described by about a dozen lines of code embedded within many thousands of lines of the display routines.
Fundamental to the graphical visualisation dilemma is the need for new
ideas of presentation. Computer code can only implement what first
originates in the human mind.
[Exercise - Display the auroral oval. Reference Jursa (1985) chapter
12 for positional algorithms and data. Use the magnetic K-index as
the only space weather input.]
6 SPACE WEATHER SENSORS
In terrestrial meteorology, there are two parameters that appear to have fundamental importance: temperature and pressure. In space meteorology there are similarly two indices that are widely used as weather indicators: solar 10cm radio flux (F10) and the geomagnetic K-index (Kp). Sometimes sunspot number (SSN) which is highly correlated with F10, and the Ap index, which is derived for Kp are also used.
These two indices are ubiquitous in the field. They are used as inputs to ionospheric models, auroral behaviour, satellite lifetime and orbital decay predictions and many other space weather predictors.
SSN and F10 are derived from measurements of the Sun at radio and optical solar observatories, and a network of such observatories now routinely makes these measurements. The K or A indices are derived from ground-based geomagnetic observatories. Again, a network of stations across the globe, now mostly automated, produces these values.
As there is a lot more to terrestrial weather than temperature and pressure, so does space weather require a diverse array of measurements, Solar imagery is desired at many different wavelengths. Satellite solar X-ray images are particularly useful, and this data is just becoming available. Watching CMEs as they travel outward from the Sun is an extremely desirable goal, but is only routinely achieved by space-borne white light coronagraphs for a few tens of solar radii out from the Sun. New radio telescopes soon to come on line may allow CME tracking further away from the Sun. These will use amplitude scintillations of quasar signals to map the interplanetary plasma. Available solar radio and X-ray data can also provide useful surrogates. Satellites at the Sun-Earth L2 Lagrange point (1.5 million km from Earth in the direction of the Sun) can provide almost an hour's warning of a potential CME impact with the Earth.
Probably the most complex arena of our immediate concern is the magnetosphere. Only a vast complex of ground-based and satellite-borne instruments will help us unravel and monitor this interface between the Sun and our near-space weather. New satellites coming on line promise to give us limited magnetospheric imagery in the near future.
Ground-based ionospheric monitors are essential for a space weather service, and it is important to realise that even when we think we completely understand a particular region scientifically (not that we do at present), we still need a monitoring service. Predictions of ground weather are not possble without a multitude of observations from a well-spaced observing grid. Neither should we expect valid forecasts in space weather after decommissioning our observing networks. A good example of this lies in meteor radar sensors. For a long time there was no continuous meteor radar patrol conducted anywhere. Meteoroid influx, however, is not constant. The Earth may intercept a new stream at any time, and confound certain systems. Fortunately a new class of meteor radars are now being deployed. Routine patrol monitoring of all space weather characteristics is important.
Until recently, predictions of solar activity have been made only through observations of the 'surface' layers of the Sun. It is now becoming possible, through sensitive helioseismology sensors, to examine the solar interior. Instruments now on-line or being deployed on the Earth and in space will hopefully open a new vista to the main driving force of space weather.
7 OPPORTUNITIES
So you want to be a space weather person? Well, the field is certainly diverse, not only in the subject matter, but also in the application. Many Australian universities have basic and/or applied research areas that encompass the disciplines important to space weather, from plasmas through astronomy and astrophysics to communications, navigation, remote-sensing and space operations.
Probably the first step is to decide on your area of interest, read all you can, and then attempt to become attached to a group that is going where you want to go.
IPS Radio and Space Services is the Australian Agency (www.ips.gov.au) that provides space weather monitoring, coordination and advice to a wide range of customers in the Australasian region. IPS maintains connections with space weather research and service bodies throughout the world. IPS also frequently advertises positions. The minimum requirement is usually a B.Sc. with a demonstrated interest in space weather. Watch the news box in the IPS home page.
As discussed, there are many fields within space weather. At the present time, high profile areas are coronal mass ejections, magnetospheric physics and helioseismology applications.
If you are interested in satellite and space operations, you will need to travel overseas, and you should plan for and pursue this as early in your career as possible. Funding for space weather comes primarily from governments. In the USA, a high degree of funding comes from the military, and a small component also comes from customers such as power companies. Universities and space agencies in Europe, Japan and the USA are the most likely places to persue space weather research.
If you are looking for ideas or modelling exercises, the Space Weather Journal published by the American Geophysical Union (AGU) is a good place to start (the quarterly printed copy is free upon application, but the full e-journal access is required to read all the scientific articles). Although no longer held, the five yearly Solar Terrestrial Prediction Workshops published large volumes of proceedings from 1979 to 1995, and these are very much worth reading for practical ideas. Space weather data can be obtained from IPS and the hosted World Data Centre for Solar Terrestrial Science. Links to other data centres around the world are also given.
8 MODELLING/VISUALISATION EXERCISES
Presented below are three student exercises in the area of space weather modelling and visualisation. They range from simple to more complex, although there is undoubtedly a vast visualisation space in which they might be presented. Actual data to test the models may be obtained from the World Data Centre for Solar Terrestrial Science at IPS Radio and Space Services (www.ips.gov.au) and the US Space Weather Prediction Center and the US National Geophysical Data Center.
8.1 Solar X-ray Ionospheric Effects
Solar x-ray flares produce an increase in the ionisation of the D-layer (60-90 km altitude). This causes absorption of HF radio signals proportional to the inverse square of the frequency of operation. At any point on the Earth, the lowest useable frequency at a given geographical position in the ionosphere is roughly specified by the formula:
where X is the solar x-ray output in watts per square metre
and χ is the solar zenith angle.
Visualise this effect, both in space and time, for a customer who might have multiple HF communication systems operating throughout the world.
8.2 Interplanetary Shock Time of Arrival
Following a coronal mass ejection, the plasma cloud travels through the interplanetary medium. Indication of this may be given by various radio spectral signatures. The model descibed by Smart et al (1986), computes the time of arrival of the shock wave preceding the CME at the Earth's orbit, and provides an indication of the magnitude of the shock.
Visualise the shock throughout space with emphasis on terrestrial interception. Use windows around the space visulation to indicate prediction at the Earth and/or specified comet/spacecraft locations.
8.3 Proton Prediction
In large solar magnetic reconfiguration events, relativistic protons are produced (and are the most dangerous of all space weather events). Solar radio data signatures and intensities have been used as indicators of proton production. Shea and Smart (1979) have desribed a model that allows the prediction of proton flux as a function of time and proton energy at geosynchronous orbit. The paper should be referred to for the necessary background and equations. Although a little dated and of questionable accuracy, it is still the only such model available. An additional paper by Bakshi and Barron (1979) will allow the proton energy exponent to be computed.
Sensor input is observation of a type II/IV radio spectral complex (as a binary decision on proton production), the peak 8800 MHz solar radio flux during the event, and the Castelli-U omega ratio of the microwave emission. All this data is available from radio telescopes at the Learmonth Solar Observatory in Western Australia.
This is the most complex of all the three exercises, both with regard to the model complexity and the visualisation component. It could range from a simple time-energy graph at geosynchronous orbit, to a full 3-D space propagation display. Accuracy can be checked against geosat proton flux graphs available in real-time at the US Space Weather Prediction Service.
9 REFERENCES AND READING
Jursa AS (Ed), Handbook of Geophysics and the Space Environment , Air Force Geophysics Laboratory, Air Force Systems Command, USAF (1985) [NTIS # ADA 167000]
Noyes RW, The Sun Our Star, Harvard University Press (1982)
Hargreaves JK, The Upper Atmosphere and Solar-Terrestrial Relations, Van Nostrand Reinhold (1979)
Smart DF & MA Shea, PPS-76 - A Computerized "Event Mode" Solar Proton Forecasting Technique, Solar Terrestrial Prediction Proceedings, 1, pp406-427, Boulder, Colorado (1979)
Bakshi P and WR Barron, Prediction of Solar Flare Proton Spectral Slope from Radio Burst Data, JGR, 84, p131 (1979)
Smart DF, MA Shea, M Dryer, A Quintana, LC Gentile & AA Bathurst, Estimating the Arrival Time of Solar-Flare-Initiated Shocks by Considering Them to be Blast Waves Riding Over the Solar Wind, Solar Terrestrial Predictions Workshop 1984, Meudon, France (1986)
Friedman H, Sun and Earth, Scientific American Books (1986)
Steel D, Rogue Asteroids and Doomsday Comets, Jacaranda Wiley (1995)
Hruska J, MA Shea, DF Smart & G Heckman (Eds), Solar Terrestrial Predictions IV, 3 volumes, NOAA ERL Dept of Commerce (USA, 1993)
Space Weather Information, IPS Radio and Space Services
Fiction
Sunstorm, Arthur C Clarke and Stephen Baxter (2005)
Space, James A Michener (1983)
Australian Space Academy
 Home
Home