INTRODUCTION
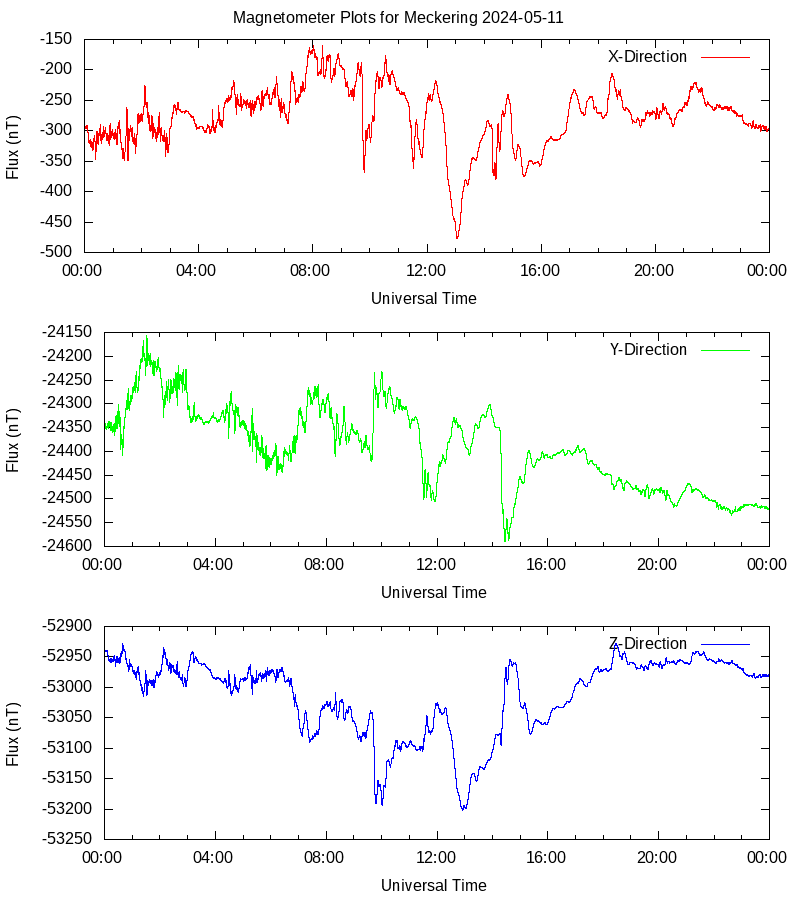
A NAROD fluxgate magnetometer, on loan from the Space Physics Group at Newcastle University, is located at the ASA Meckering site to monitor the three components of the Earth's magnetic field. A daily graph from this instrument is shown below. A full data set is archived.
MAGNETOMETER GRAPH

EXPLANATION
The x plot is along the N-S axis, the y plot is along the E-W axis and the z plot is the vertical component of the Earth's magnetic field. The two horizontal field components are of most interest for space weather purposes. The vertical component is affected more by the local geology.
 Australian Space Academy